Full Report
Fit
Outside the framework's universe (U2 not met); contested: P2
At a $2.79B market capitalization SPS Commerce sits about 72% below the framework's $10B scale line (U2), so the screen stops before any dislocation setup is underwritten — the overall verdict is Outside the framework's universe. Confidence is high: the two model families agreed unanimously on every gate, the diagnosis trial was order-stable, and load-bearing spreads were at most 0.15. No exclusion fired and no prior-driven-risk flag was raised. One criterion is contested — P2 (FCF consistency).
Market Cap ($M) vs $10B bar
Peak-to-Trough Drawdown
Adj. FCF Yield vs 8.5% bar
Diagnosis p(temporary)
Sources: market cap and drawdown from the reported feature set (price 2026-07-31); adjusted FCF yield derived from the FY2025 10-K cash-flow statement [1]; p(temporary) from the diagnosis trial.
The overall call is set by a single deterministic rule — U2 not_met -> out_of_universe. Because scale is a universe test, it short-circuits everything downstream: the pillar work below is reported in full, but none of it can move a company that is not in the universe back into it.
Universe and exclusions — unsoftened
U1 — Listing: met. SPS Commerce is a Delaware-incorporated, Minneapolis-based US issuer whose common stock is a primary Nasdaq listing under ticker SPSC (Commission file 001-34702); it is not a European ADR and carries no China-domicile disqualifier [2]. Vote: unanimous met across all four jurors.
U2 — Scale: not met. Market cap is price 73.39 (2026-07-31) x 37,992,000 shares = $2,788,232,880 ≈ $2.79B, roughly $7.21B — about 72% — below the $10B line. Even the pre-drawdown peak close of $215.42 (2024-07-31) implies only ~$8.18B on the current share count, so no price in this window clears the bar. Vote: unanimous not_met. This is the criterion that decides the verdict.
Source: derived from reported price and FY2025 diluted share count; peak close 2024-07-31.
Exclusions — none fired. X1 (auto OEM): not a hit — SPS is a cloud supply-chain / EDI network with 96% recurring software revenue and no vehicle manufacturing [3]. X2 (promotion pattern): not a hit — a said-versus-did gap exists (the "15% or greater" growth algorithm was dropped and Carbon6 was divested at a loss), but the second prong is not the promotion archetype: near-term profit guides held and the reversal crystallized a loss rather than hiding it, and insider economics are weak-but-honestly-gated [4] [5]. X3 (structural decline): not a hit — no realized volume, share, or pricing loss that fails to mean-revert (100th consecutive quarter of revenue growth) [6]. X4 (consensus-saturated story): not a hit — ~3.7x sales after a 76.8% drawdown with forward estimates being cut, the opposite of a chased growth narrative. All four are unanimous not_met across both model families.
S1 — China dependence: not flagged. Largest customer is under 1% of revenue, no geographic revenue concentration is disclosed, and only immaterial non-US property is on the books [7]. The corpus carries no explicit US-vs-China revenue split, so this rests on the absence of any China disclosure rather than a stated 0% (see Data gaps).
Pattern match
The framework's dislocation screen distinguishes entries mainly by balance sheet and return engine: a fortress net-cash compounder whose stable FCF yield has jumped toward the bar; a moderate-leverage name; a levered turnaround carrying an explicit yield-and-share-reduction exception; and a dividend-anchored income name (P4c). Cutting across all four is the diagnosis test that separates a real dislocation from a value trap — whether the impairment is temporary (NPV broadly intact) or permanent.
On the balance sheet, SPS is squarely the fortress net-cash compounder shape: zero funded debt, $151.4M cash, no dividend, and a buyback that stepped up into the fall [8]. But two of the shape's defining checks do not confirm. The fortress signature — a stable ~3.5–4% yield that suddenly jumped toward the bar — is absent on the framework's adjusted basis: adjusted FCF yield is ~0.17%, not near the 8.5% bar. And the dislocation carries an inverted signature — a growth-rate reset with no numerator impairment — rather than the capitulation on cut earnings the pattern expects. Framing aside, the setup question is moot here: the universe miss stops the screen before any of the four patterns is underwritten.
The pillar ledger
Reference lines below are the framework's own bars; the verdicts are the tally's, not re-derived here.
Source: the deterministic Fit tally (per-criterion verdicts, probabilities, and spreads).
Year-10 gate — P1: met (p 0.795, spread 0.09)
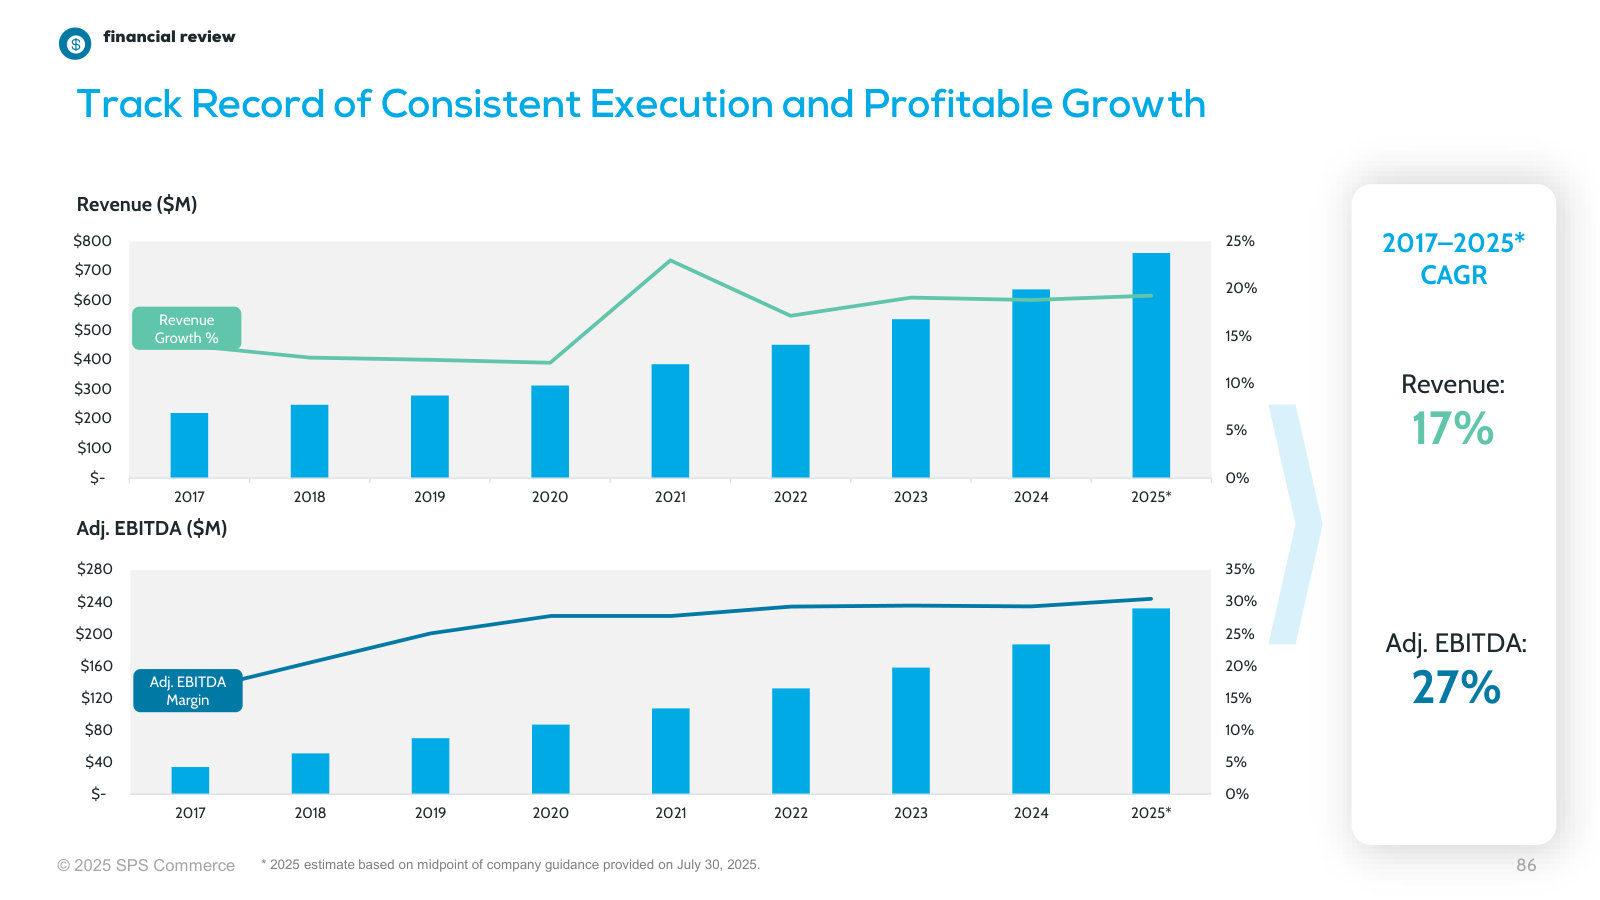
Revenue rose every year from $193.2M (FY2016) to $751.5M (FY2025), a ~16.3% CAGR across 100 straight quarters of growth on 96% recurring revenue in a fragmented market it leads [9] [10] [11]. Year-10 revenue durability clears the gate with high conviction; the disqualifier (three consecutive years of high-single-digit revenue decline) is nowhere near triggered. The strongest surviving counter sits inside the same finding: FY2025's 20% customer-count jump was almost entirely the acquired Carbon6 cohort (organic net adds ~750), later divested at a ~$23.5M loss, and the stated growth framework was cut from "15%+" to "at least high single digits" [12] [13]. So year-10 adjusted-FCF durability is softer than the headline, but P1 is unanimous met and cross-family. Full treatment: the Business tab.
Consistency — P2: contested (cannot_determine vs not_met)
This is the one contested criterion. The split is a genuine cross-family disagreement (jurors a, c: cannot_determine; b, d: not_met), not a factual dispute. On the raw basis FCF is exceptionally durable — ten straight positive years, a monotone rolling-5-year average climbing from $41.2M to $115.1M, one -14.1% dip (FY2022). On the framework's adjusted definition (FCF minus SBC minus trailing-5-year-average cash acquisitions) recent-year adjusted FCF collapses to roughly -$2.3M (FY2024) and +$4.7M (FY2025) because acquisition outlays ran $147.9M and $142.6M [14]. The deterministic fcf_stability feature could not compute at all (SBC null, acquisitions zeroed in the feed), so no full rolling-5-year adjusted series exists — hence the cannot_determine reading. Both readings appear again under Contested below. Full treatment: the Durability tab.
Dislocation and yield — P3a met, P3b met, P3c not_met, P3d not_met (p 0.105, spread 0.02)
The drawdown has a dated trigger: on the Q2 FY2025 call (2025-07-31) management reset the multi-year growth algorithm and the stock fell -22.0% that session — one of four scheduled-earnings legs across a 651-day, -76.8% fall [15]. Volume ran ~6.96x the trailing median at its 20-day peak, well past the 2x reference line (P3b met, reported as a measure). The counter, carried in the same treatment: the -22.0% reaction landed on a +10.3% normalized-EPS beat and the volume spikes cluster on scheduled earnings days — consistent with an orderly information-driven re-rating as much as a fear-driven capitulation.
Yield is where the setup fails on its own terms. SPS is a fortress (net cash, zero funded debt), so the applicable reference line is 8.5% [16]. Adjusted FCF yield computes to ~0.17% — about 833 bps below the bar — because the trailing-5-year average acquisition charge (~$93.9M) and SBC (~$53.7M) consume nearly all of the $152.3M reported FCF [17]. Even the most charitable read the framework forbids — unadjusted FCF (5.46%) or consensus FCF (5.80%) — stays below 8.5%. The forward path (P3d) does not close it: consensus forward yield rises 5.80% → 6.55% → 7.20% → 7.93% (FY2025–FY2028) and never reaches the bar within three years, and those figures are themselves unadjusted, so the adjusted forward yield is lower still — p(clears within 3y) ≈ 0.105. The counter carried alongside: consensus FCF is modeled up ~37% to $221.0M by FY2028, so the trajectory points toward the bar, just not within the window. Full treatment: the Dislocation and Yield tabs.
Balance sheet and self-help — P4a met, P4b not_met, P4c not_applicable
The balance sheet outlasts the problem trivially: $151.4M cash, no borrowings line, no maturities or covenants to crowd out repurchases [18] [19]. The counter inside P4a: headroom has been routed M&A-first — roughly $568M of acquisitions FY2020–FY2025 against roughly $234M of buybacks, more than 2:1 [20]. P4b fails on the hard-fail path: diluted shares rose from 36.285M (FY2020) to 37.992M (FY2025) — a +0.92% CAGR — because buybacks roughly matched SBC rather than shrinking the count. The counter is a genuine, price-timed buyback escalation ($0 FY2023, $37.6M FY2024, $114.3M FY2025, against a $300M authorization) that shows capacity and intent even though the count has not yet inflected down [21] [22]. P4c is not applicable: SPS has never paid a dividend and states no intention to [23]. Full treatment: the Self-Help tab.
Diagnosis — P5: met (p_temporary 0.58, spread 0.13)
The adversarial trial (two opposing cited briefs, three independent judges) settled the temporary-vs-permanent question at p_temporary 0.58 (mean 0.60, spread 0.13, order-stable, not contested). The de-rating is an inverted signature: consensus FCF rises $161.7M (FY2025) to $221.0M (FY2028) and normalized EPS $4.13 to $6.00 while revenue grew +17.8% — the near-term earnings numerator never fell, so the damage is a growth-rate reset and multiple compression [24]. The strongest permanent-case counter carried in the same treatment: the Amazon revenue-recovery line was impaired by Amazon policy changes, and SPS sold the entire third-party revenue-recovery unit in June 2026 at a $23.454M loss on sale — a growth leg cut, not paused [25] [26] [27]. Full treatment: the Damage Math tab.
Instrument context — I1: not_verifiable
Listed SPSC options exist and 30-day implied volatility is 51.74% (2026-07-31), within the ≤55 acceptable line — but a dated, citable source confirming ≥12-month LEAPS with adequate open interest and spreads was not obtainable this pass (longest verifiable expiry ~5 months out). I1 never blocks a pillar verdict; it drives only the watchlist overlay, which applies solely to fits/lean_fit outcomes and is therefore inert here. Full treatment: the Clock tab.
What a 3x-in-3-years would require
The framework's target test cannot be rendered as arithmetic for this name. The re-rating math is unavailable: the tally records that the applicable bar or normalized adjusted FCF is missing, so there is no price-at-bar-yield, no implied market cap, and no base-rate overlay to compute. In plain terms, with adjusted FCF running near zero after SBC and the trailing acquisition charge, there is no stable normalized adjusted-FCF figure to capitalize at the 8.5% bar — the input the target test needs does not exist for SPS on the framework's own definition.
Contested and undetermined
Contested — P2 (FCF consistency). Both readings are on the table, split cleanly by model family:
cannot_determine (jurors a, c): the deterministic
fcf_stabilityfeature is empty — SBC is null and acquisitions are zeroed in the cash-flow feed for every year — so no rolling-5-year adjusted FCF series can be built; only FY2024 and FY2025 are fully computable from primary statements, short of the five consecutive observations the criterion asks for.
not_met (jurors b, d): rebuilt from the annual filings, adjusted FCF is razor-thin to negative in the latest years (FY2024 ≈ -$2.3M, FY2025 ≈ +$4.7M) because the trailing-5-year acquisition charge grew to ~$85–94M/yr, so the stable, acceptable-volatility adjusted series the criterion requires is not evidenced [28].
Nothing else was contested. No criterion resolved to cannot_determine at the tally level (P2 aggregates to contested, not cannot_determine), so there is no undetermined criterion to name here.
Provenance
Source: the Fit tally provenance block and the skeptic refutations ledger.
The verdict was not close and it was not fragile: two independent model families reached the same gate calls, the diagnosis trial gave the same answer regardless of which brief the judges read first, and swapping the company's name out of the evidence moved no gate and shifted probabilities by at most 0.015. Of sixteen claims checked in full, none was refuted; three were weakened (the price-vs-NPV gap is assumption-sensitive, the driver-that-broke uses newer filing figures, and the share-count trend has a fresh interim buyback inflection), and one — the long-dated-options fact — could not be verified from the corpus.
The falsifier ledger
These are the standing what-would-change-this conditions carried from the tally and the diagnosis trial; each names its threshold, direction, and window where defined.
Data gaps
- Adjusted FCF is not_computable in the feature set — SBC is missing from the cash-flow feed for FY2016–FY2025, so the framework's adjusted-FCF prong rests on raw FCF ($152.3M FY2025) plus hand-computed SBC (~$53.7M) and ~$94M/yr trailing average acquisitions rather than a single verifiable adjusted figure.
- No full rolling-5-year adjusted-FCF series can be built — pre-FY2020 acquisition figures were not retrieved, so only FY2024 (≈ -$2.3M) and FY2025 (≈ +$4.7M) are fully computable; five consecutive fully-adjusted observations are the exact P2 input and do not exist in-corpus.
acquisitions_cashreads $0 for every year in the canonical feed — a feed artifact contradicted by the audited 10-Ks (~$568M of cash acquisitions FY2020–FY2025); SPS must not be treated as a zero-M&A name.balance_sheet_classreturned "unknown" (feed missing FY2025 debt/cash); classified fortress from the primary FY2025 balance sheet (cash $151.4M, no funded debt), corroborated by consensus net cash of -$172.4M.- No explicit US-vs-China revenue split is disclosed — the S1 not-flagged conclusion is inferred from under-1% customer concentration and immaterial non-US property, not a stated China percentage.
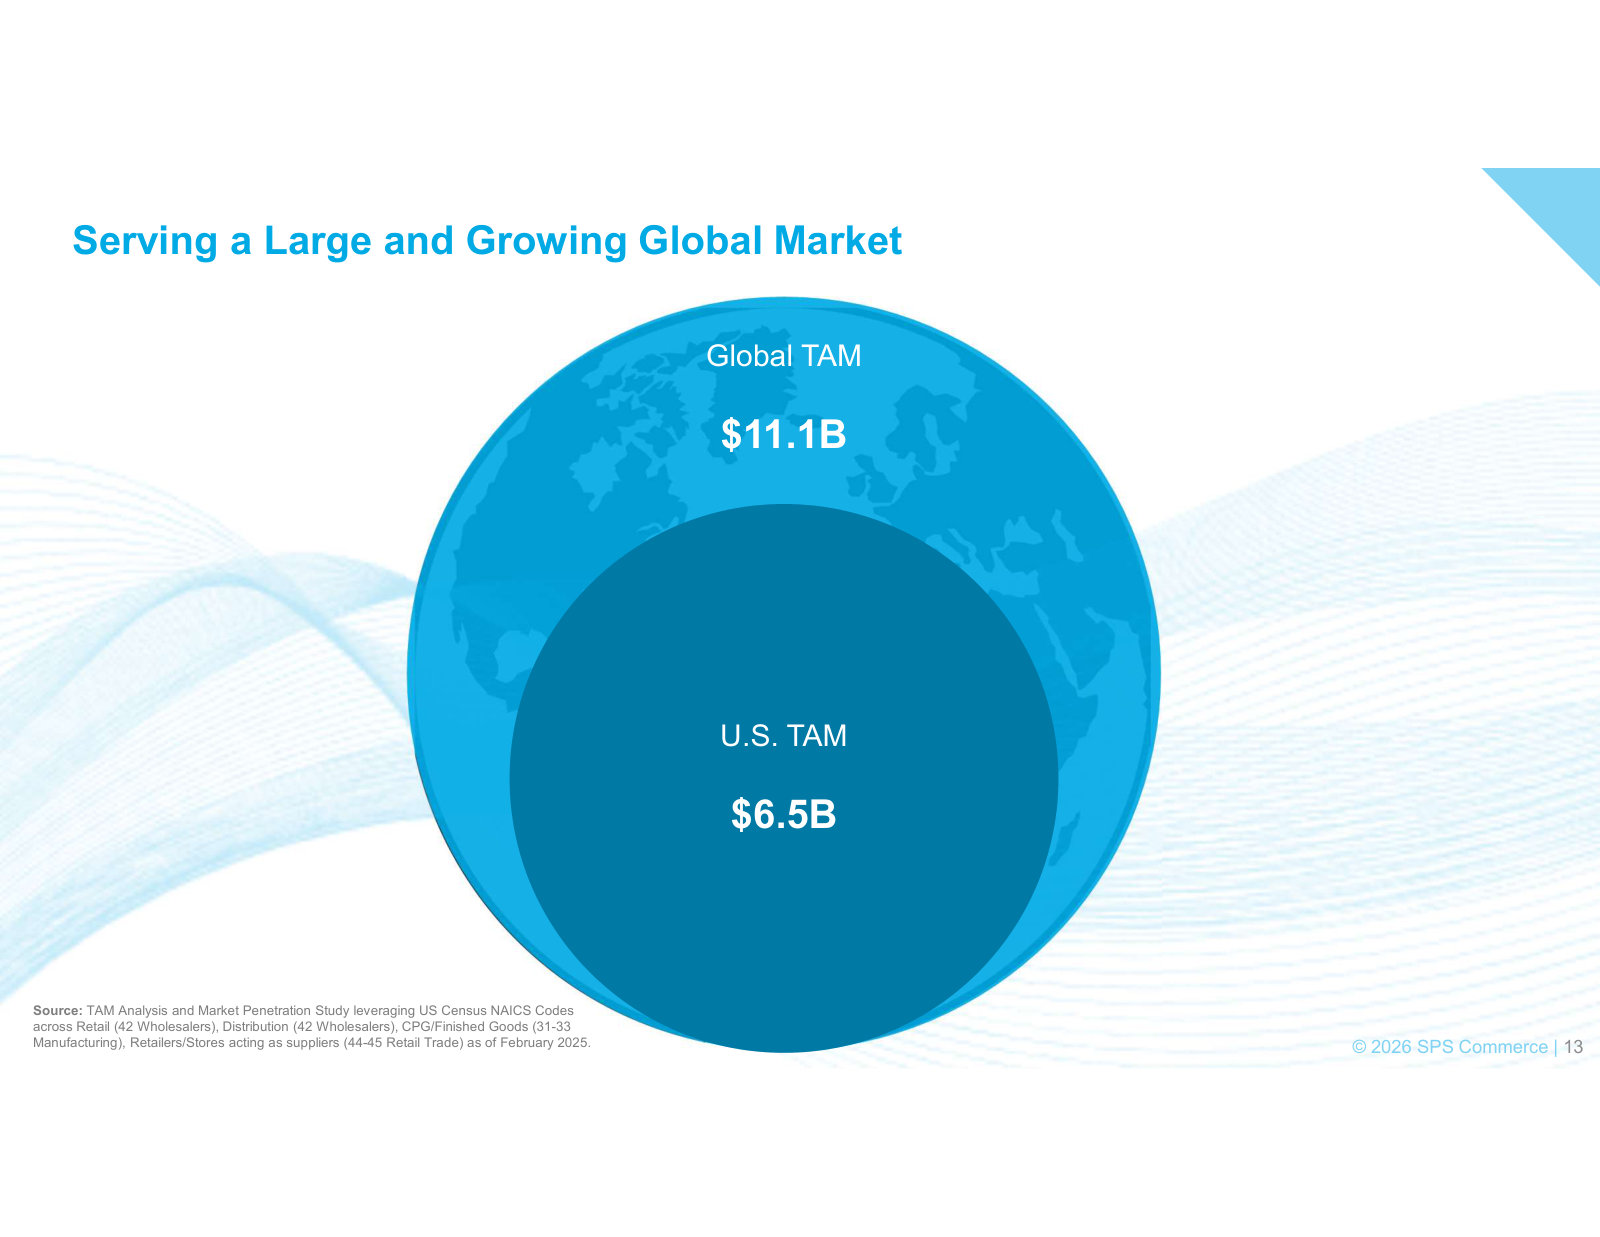
- SPS's TAM ($11.1B) is self-sourced from its own consultant with no independent market-size estimate in the corpus to triangulate the P1 runway.
- Organic-vs-inorganic growth split is not reconstructable — SPS states in SEC correspondence it does not track revenue by new vs existing customers; the organic run-rate can be bounded (high-single-digits per management, ~5.3% forward per consensus) but not pinned.
- Pre-drawdown (peak-era, mid-2024) consensus is not in the estimate feed (FY2025–FY2028 only), so the before-and-after consensus delta rests on the growth-rate reset and the six-month revision trail rather than a full peak-era snapshot.
- Peak market cap ($8.155B) is a period-mixed derivation (2024-07-31 close x FY2024 diluted shares), so the -$5.37B / -65.8% mcap damage is approximate at the ~1% level.
- Long-dated instruments (I1) unverifiable — a dated source confirming ≥12-month LEAPS with adequate open interest and spreads was not obtainable; current IV (51.74%, 2026-07-31) and options existence are verified.
Checked and unremarkable
No scout memo returned a routine or empty verdict — all eight (accounting/cash quality, business economics, capital allocation, competition/moat, history/track record, industry, people/governance, valuation/expectations) were load-bearing and fed the pillar work above.
Playbook version
Playbook fcf-dislocation, version 4 (spec playbook/fit-spec v2), frozen for this run.
Network, Marked Down
SPS Commerce sells something most investors never see and every large retailer depends on: the plumbing that lets a supplier and a store trade purchase orders, invoices, and shipping notices without either side building the connection by hand. It has done this for long enough — a 100th consecutive quarter of revenue growth closed out 2025 — that the business now reads like a utility, with 96% of its $751.5 million in FY2025 revenue recurring and no single customer worth as much as 1% of the total [1]. And yet, over the two years to July 2026, the stock lost roughly two-thirds of its value — a deeper fall than any company it competes with except one.
That gap is the reason to look closely. This report follows the split inside it. SPS runs a full-service retail EDI network whose connection flywheel still shows up in peer-leading growth and clean cash conversion; the 2024–2026 stock collapse came from a reset in the growth algorithm after acquisition-flattered customer additions rolled off and the Amazon third-party detour was sold. The core Fulfillment network may still be compounding — while the founder-exited management era must prove that richer wallet share and margin expansion can replace customer-count growth without leaning on M&A or buybacks. This chapter establishes the network, the field it plays on, and the paradox that makes the price interesting now. The chapters that follow trace the mechanism, the margins, and the people spending the cash.
Connect once, transact with thousands
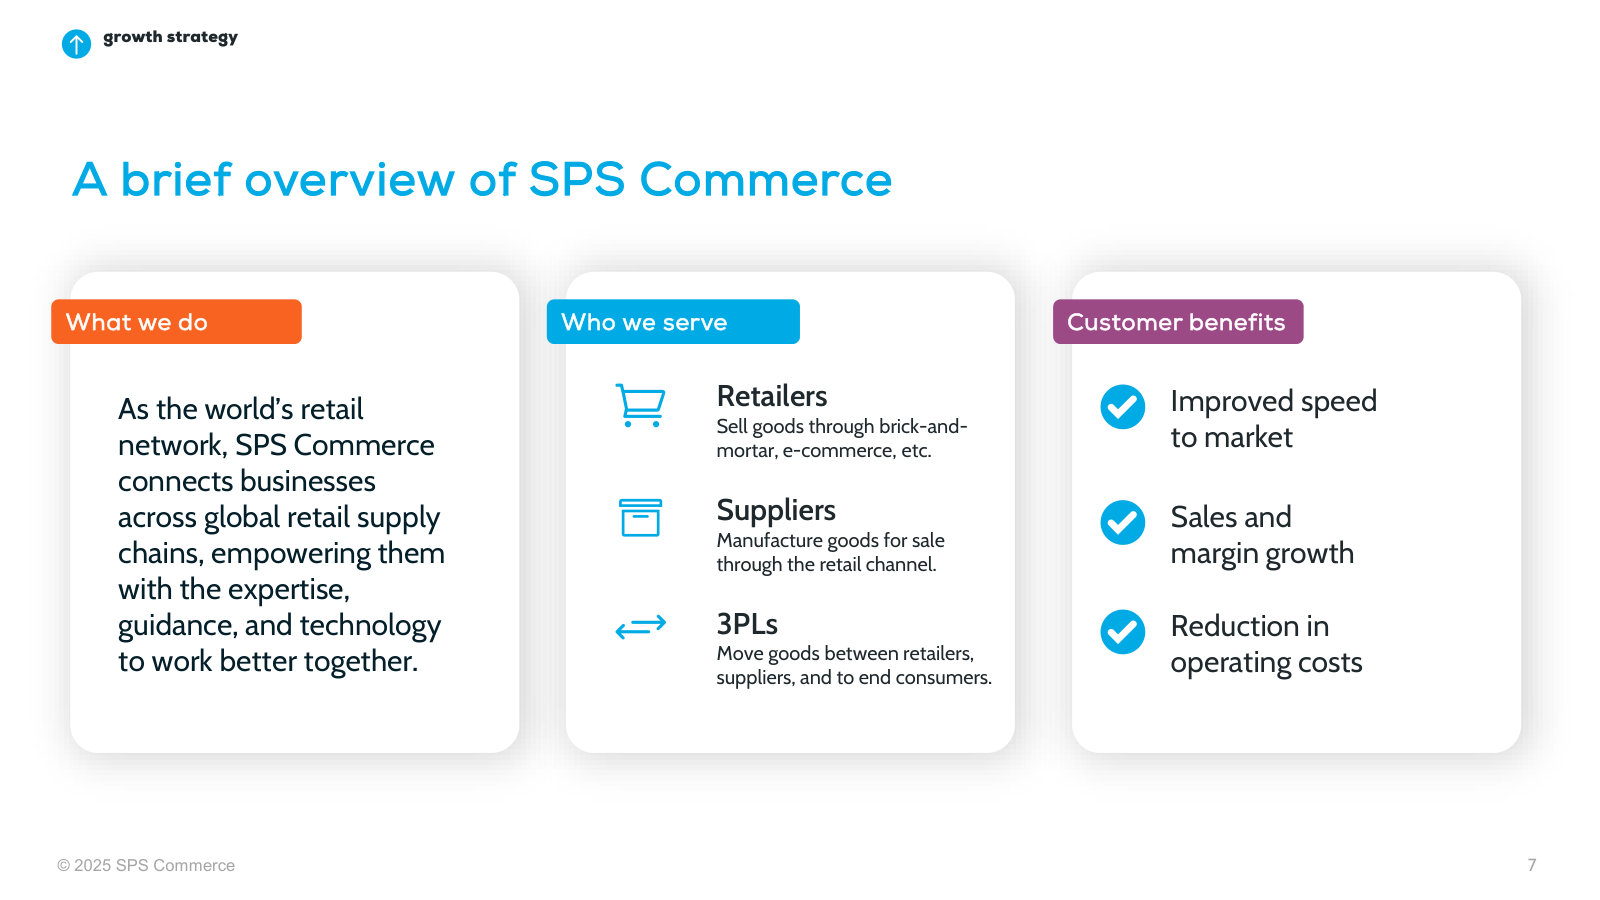
The market SPS serves solves a specific, unglamorous problem. A supplier that wants to sell to Target, Kroger, and a regional grocery chain must exchange structured electronic documents — the format known as EDI, electronic data interchange — with each of them, and every retailer keeps its own rules for how those documents must look. Built by hand, each connection is a small integration project that has to be maintained forever. SPS replaces that with a shared network: a customer connects once to SPS and can then transact with any trading partner already on it, while SPS maintains the compliance rules, onboards the partners, monitors the transactions, and resolves the errors [2].
FY2025 Revenue
Revenue Growth (FY2025)
Recurring Revenue
Recurring Customers
Source: FY2025 Annual Report (Form 10-K), Item 1 Business — revenue, recurring share [3]; recurring-customer count from the Q4 FY2025 earnings call [4].
The industry sorts itself into three delivery methods, and the distinction is the whole story of where SPS sits. Suppliers can license traditional on-premise software and run the integration themselves; they can buy managed services; or they can hand the entire function to a full-service cloud provider that "customizes, optimizes, and operates the technology" on their behalf [5]. SPS is a full-service provider. That choice — doing the work rather than selling the tool — is what makes the service sticky, and, as later chapters show, it is also what holds its operating margin below the software-only names it is measured against.
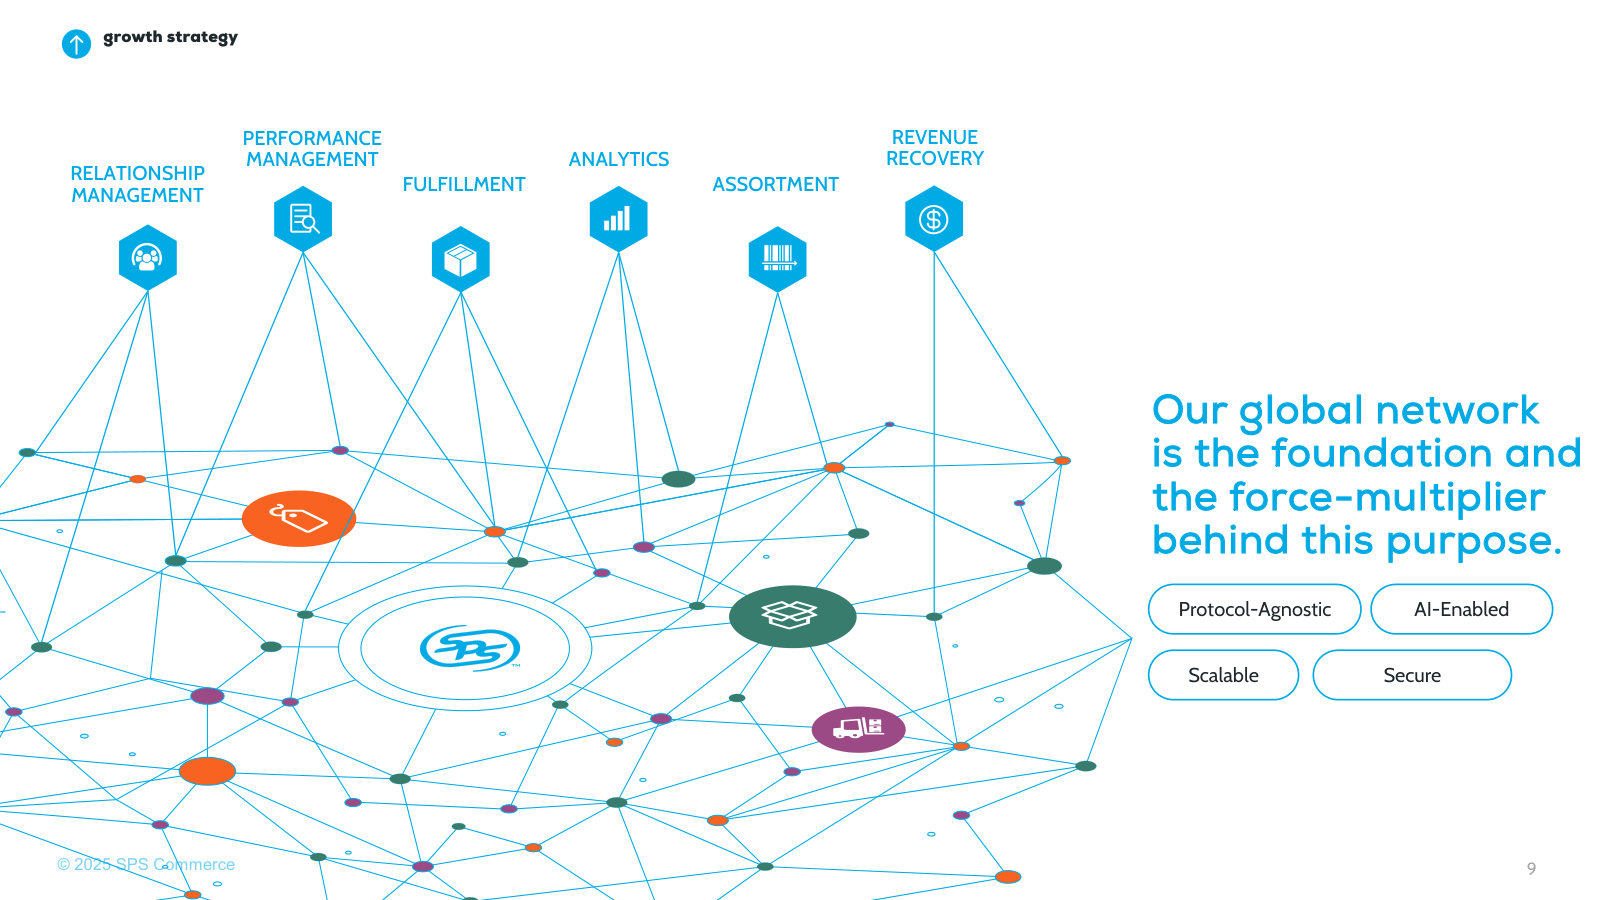
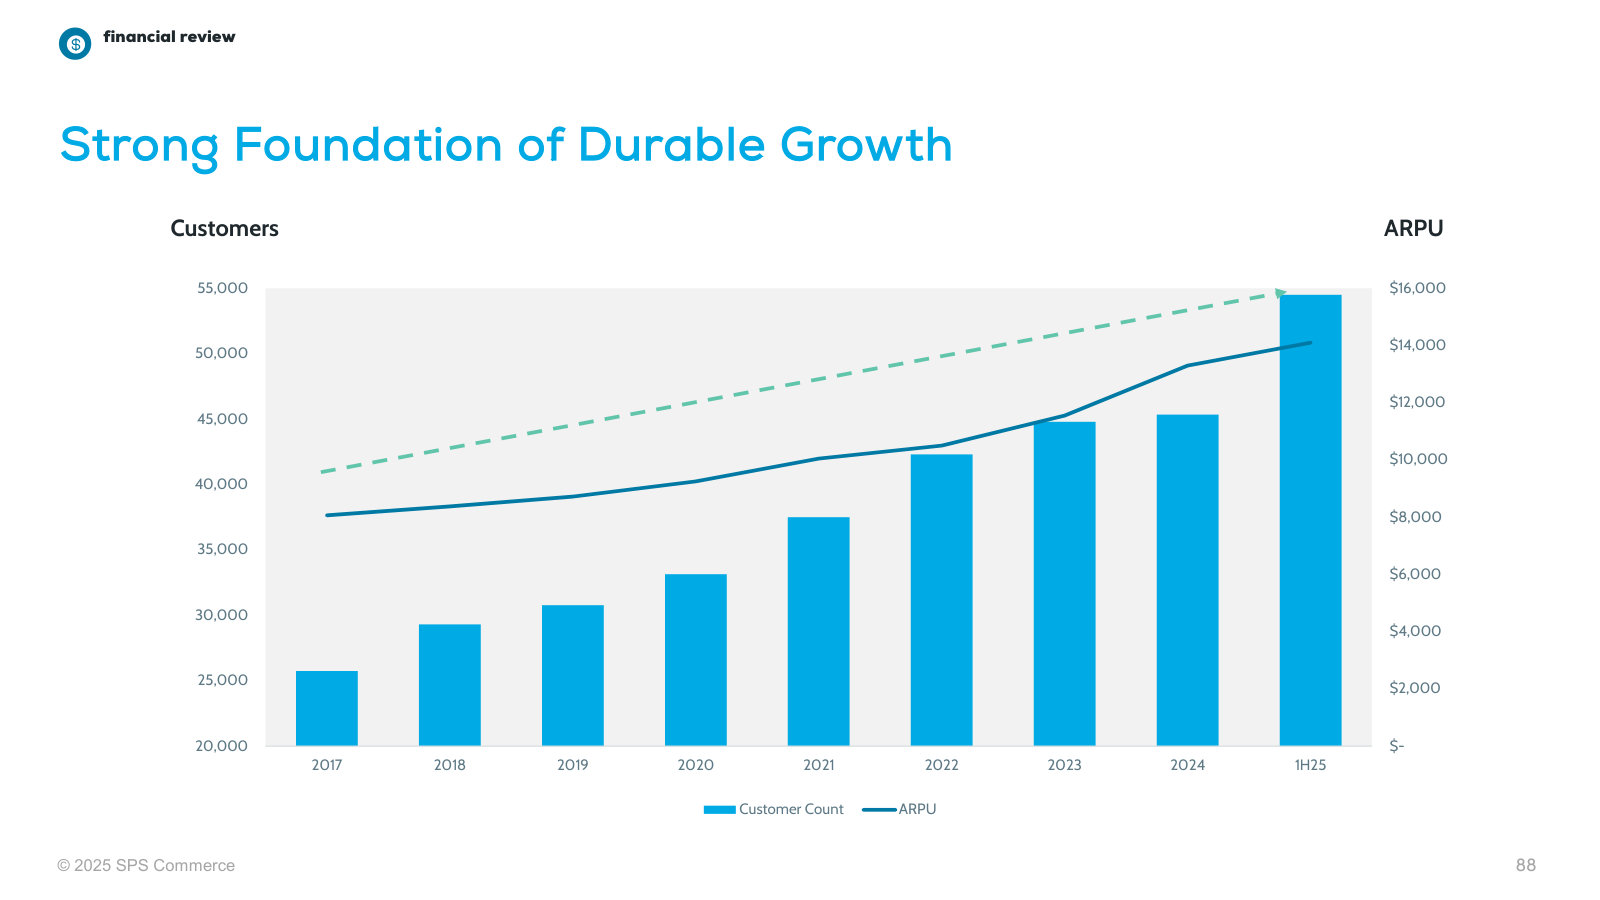
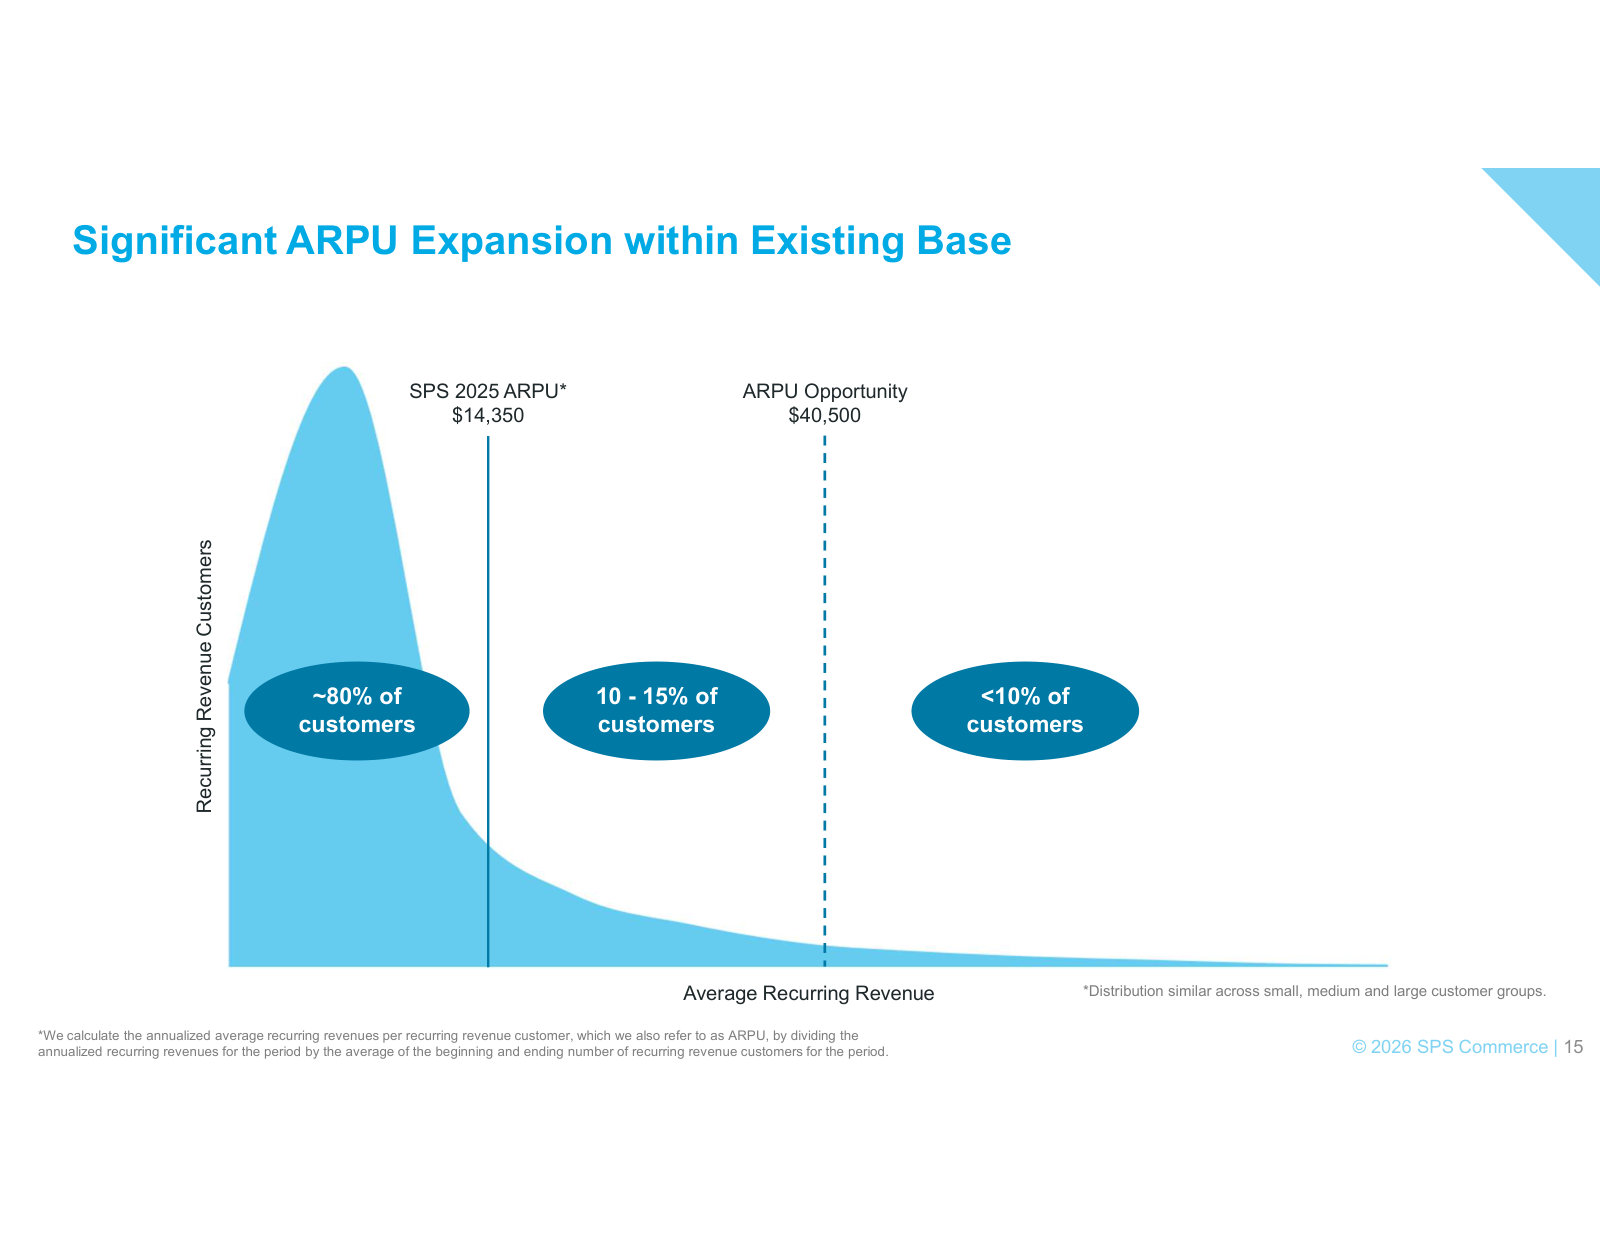
The value of such a network compounds with its own size. In the company's words, "the value of our network increases exponentially with scale": a new customer typically finds that many of its existing trading partners are already connected, so it can transact immediately, and every partner already on the network gains one more counterparty to reach [6]. By the end of 2025 SPS carried roughly 54,600 recurring-revenue customers spending an average of about $14,300 a year [7]. That is a genuine network effect — a self-reinforcing customer-acquisition channel, not just a good product — and it is the mechanism to hold onto as the rest of the report questions whether it is still turning.
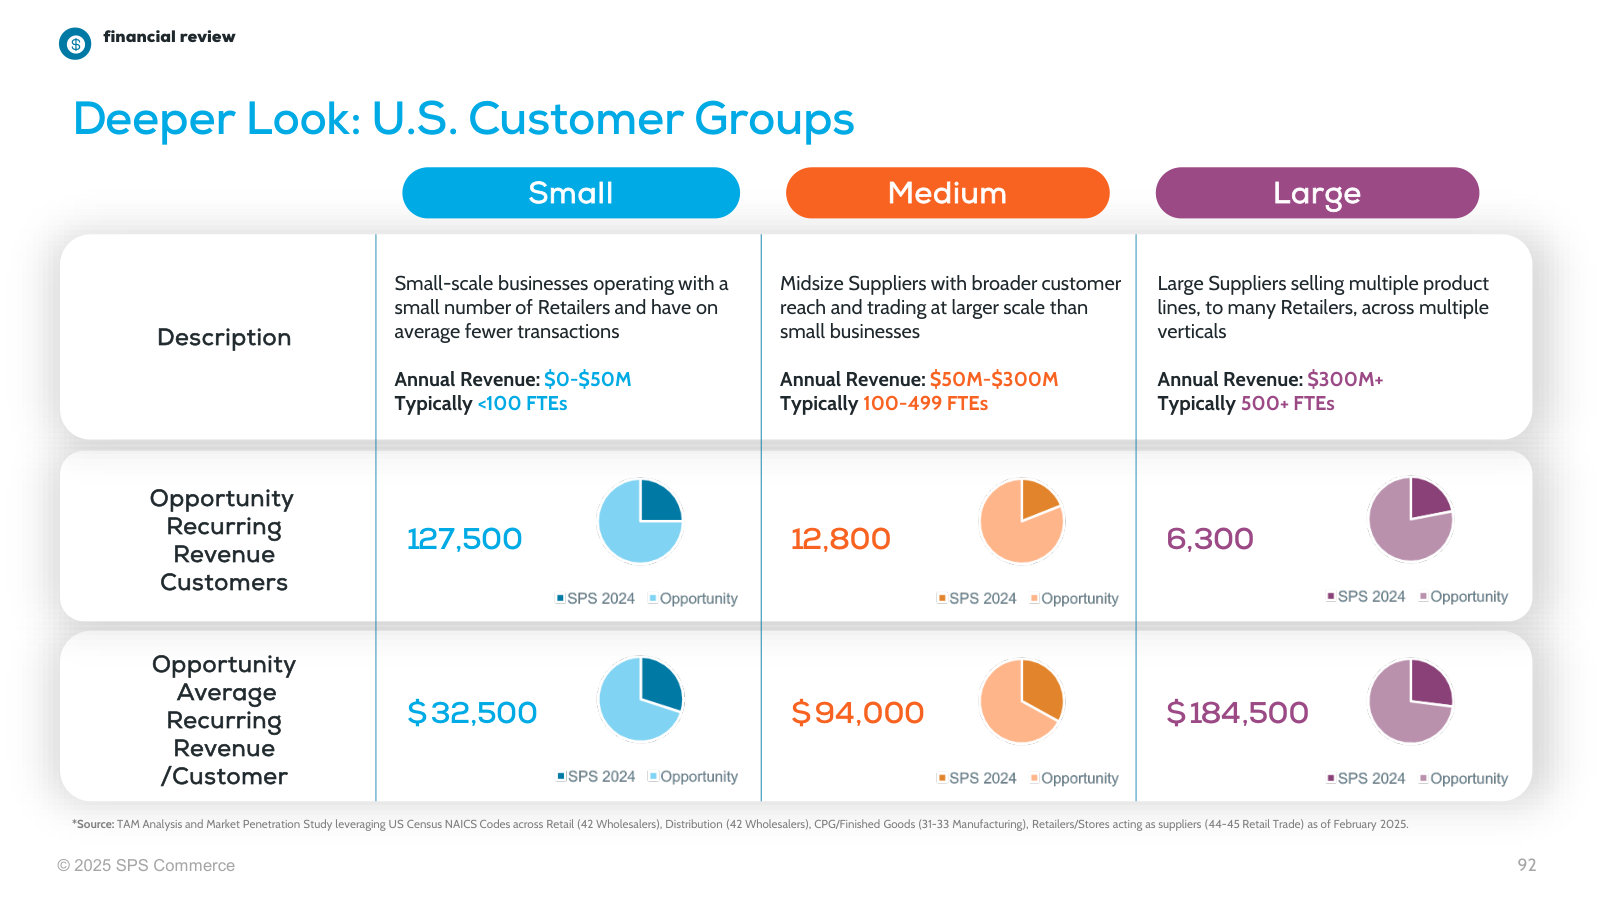
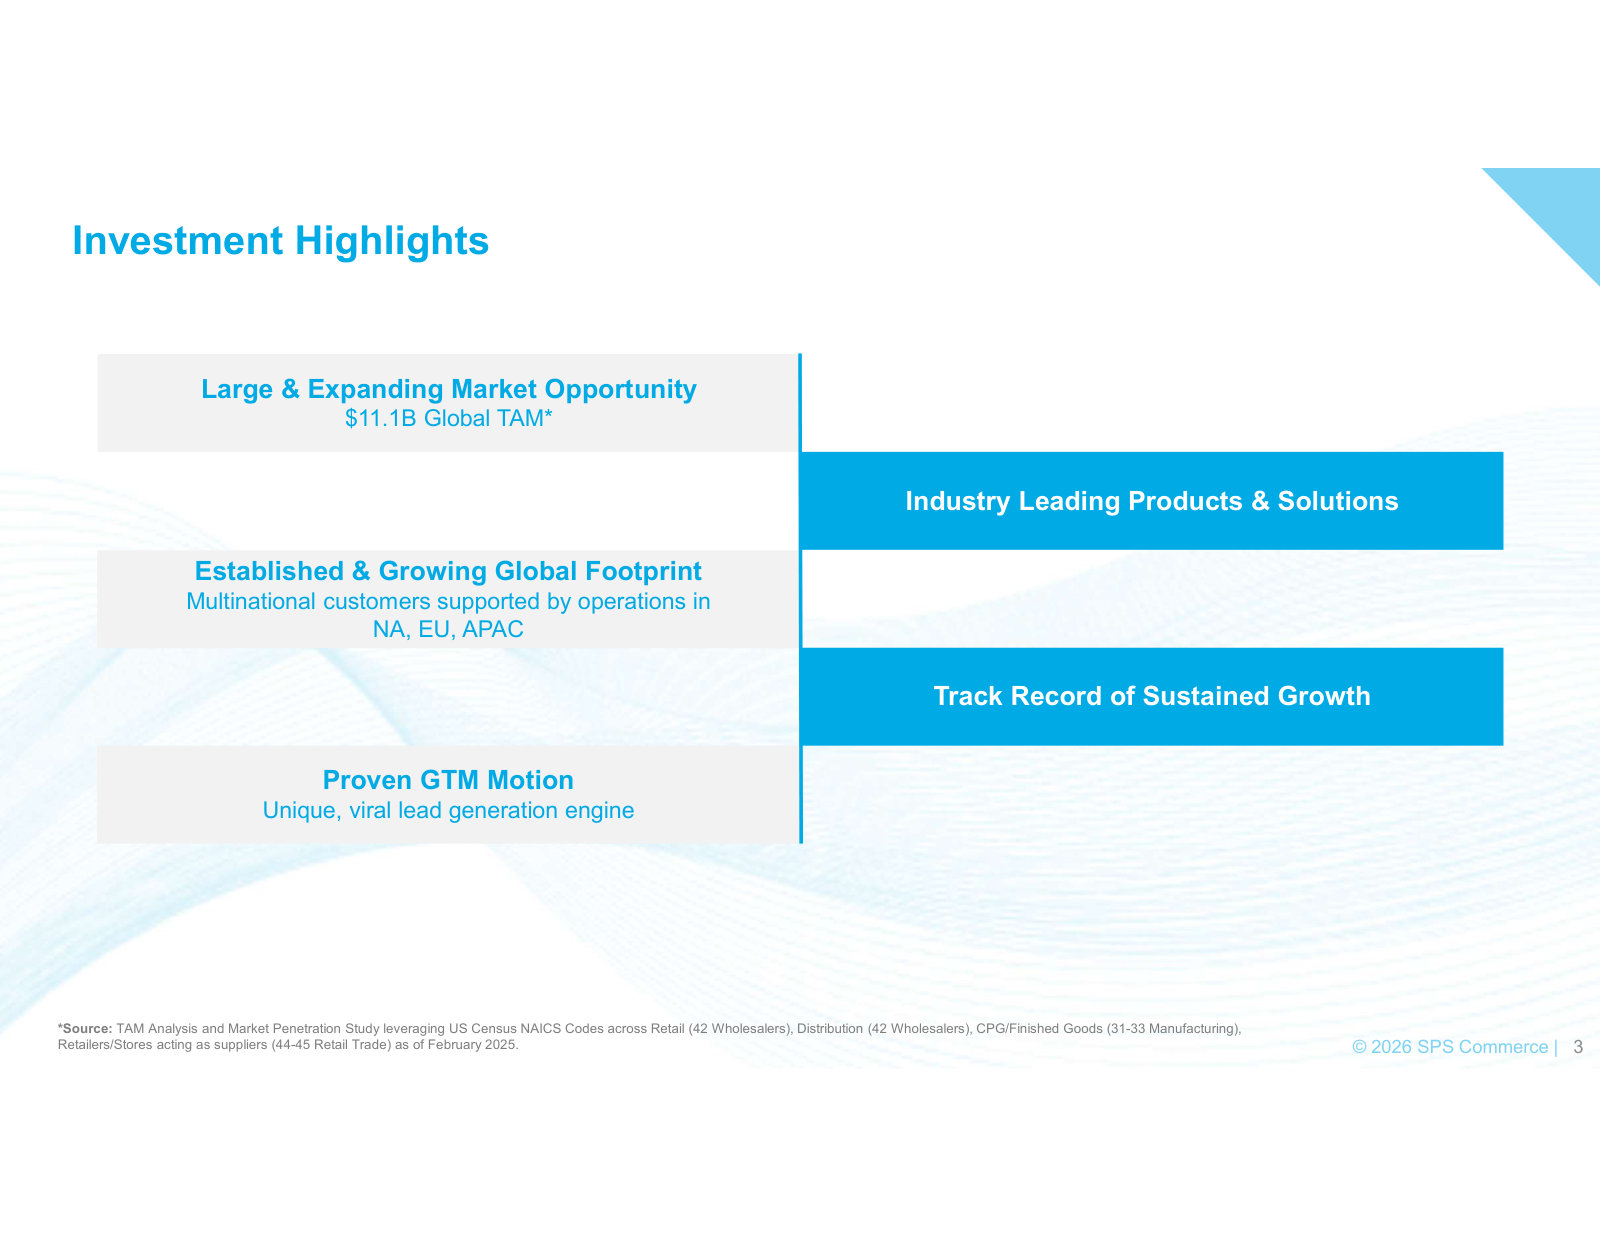
The field is crowded and split. SPS itself calls the market for cloud-based supply-chain management "fragmented and rapidly evolving," competing on the breadth of pre-built connections and a history of reliable ones far more than on price or features [8]. Management sizes the opportunity, via a third-party consultant, at $11.1 billion globally — about 275,000 potential customers at roughly $40,500 of average annual spend [9]. Against $751.5 million of revenue, that puts SPS near 7% of the dollars and a fifth of the potential accounts — a long runway on the company's own math, with the honest caveat that the figure is self-sourced and no independent estimate in the record confirms it.
That the network structure is real, rather than one company's marketing, is visible in how competitors describe their own businesses. OpenText markets its Business Network Cloud as a way for "organizations of all sizes" to "rapidly onboard new trading partners, comply with regional mandates … [and] provide electronic invoicing" — SPS's exact value proposition, sold by a company more than six times its size [10]. Descartes runs a logistics network on the same logic. So the competitive set is not a single scaled rival but a fragmented mix: giant diversified players such as IBM and OpenText for whom B2B networks are one line among many, plus a long tail of small value-added networks, with SPS concentrated in the retail supplier-onboarding niche.
The share-taker
Inside that mature field, SPS grows like something much younger. FY2025 revenue rose 17.8%. The median of its named public peers grew 3.7% — a gap of 1,409 basis points — and the spread runs from OpenText shrinking 10.4% to IBM at 7.6% and Manhattan Associates at 3.7%.
Source: reported financials, FY2025 — SPS FY2025 revenue of $751.5 million [11] and each peer's FY2025 filing; OpenText Business Network Cloud [12].
This is the first anomaly the report owes an explanation: SPS grew nearly five times the peer median while the one rival it competes against most directly, OpenText, was contracting. Growing that much faster than the field, and faster than the incumbent selling the identical promise, is the signature of a company taking share rather than defending it — and the network effect is the plausible engine. Two structural conditions support the pace. The first is switching cost as inertia: SPS's contracts are largely auto-renewing, its revenue is 96% recurring, and no customer matters enough to move the numbers if it leaves [13]. The second is a demand tailwind that shows up in more than one company's filings.
That tailwind is government e-invoicing regulation. As more countries mandate electronic invoicing for tax purposes, a compliance obligation becomes recurring network demand. SPS's management notes that "e-invoicing capability is a frequent requirement for customers implementing fulfillment outside of the U.S. in countries where there is an e-invoicing mandate" [14], and OpenText independently attributes network expansion to the same rising requirement [15]. A condition two competitors describe on their own is a sturdier fact than one the company claims alone. The benefit is real but geographically concentrated in Europe, while SPS's base is still overwhelmingly North American — so it depends on an international expansion SPS has not yet scaled.
The harder-to-call force is AI, and the industry is genuinely of two minds. Descartes argues that proprietary network data becomes more valuable as AI spreads — "Data is the fuel for AI solutions," and it must come from a trusted source [16]. On that reading, the compliance and connection data these networks hold deepens the moat. The opposite reading is equally available: the single most important competitive basis SPS names is the breadth of pre-built integrations, and AI is precisely the technology that lowers the cost of building an integration. The same shift could widen the entry barrier or erode it, and nothing in the current record settles which. Meanwhile the adjacent players are not standing still — Manhattan Associates reported competitive win rates above 70% with most new bookings from net-new logos, evidence that well-capitalized neighbors keep pressing on the same retailer-and-supplier base SPS serves [17].
Marked down harder than anyone
Here the operating record and the share price part company. From a high of $215.42 on 31 July 2024, SPS closed at $73.39 two years later — a 65.9% drawdown, against a peer median of 39.1%. Only WiseTech, at 73.9%, fell further; OpenText, IBM, and Manhattan each gave back between 32% and 40%. The 2,682-basis-point gap to the median says the market repriced something specific to SPS, not a sector or interest-rate move that would have taken the whole group down together.
Source: derived from daily price data through 31 July 2026 (SPS and peers); peer median −39.1%.
What makes the fall unusual is when it happened. The collapse ran across earnings days — the stock fell 13.8% the day it reported in February 2025, 22.0% at the end of July 2025, and 20.8% at the end of October 2025 — and on each of those reports, and every one in between, normalized earnings per share came in above consensus. Across the eight quarters through mid-2026, EPS beat by between 10% and 18% each time.
Source: consensus estimates and reported results; each quarter's normalized EPS exceeded consensus.
A stock that falls on beats is not being punished for the quarter it delivered. It is being repriced for the growth it is now expected to deliver. That is the shape of this decline: a growth-rate reset and multiple compression, not an earnings failure. The arithmetic of the current price bears it out. At $73.39 the market values SPS at roughly $2.8 billion, about 14.9 times forward normalized EPS and a 6.5% forward free-cash-flow yield — a low-double-digit multiple for a business with 69% gross margins, roughly 20% free-cash-flow margins, and net cash on the balance sheet. The multiple that once priced high-teens compounding is gone. In its place, consensus embeds forward revenue growth of about 5.3%, down from the 17.8% just delivered, and the sell-side has converged its price targets to a mean of $72.73 — at or below the spot price, pricing the reset as the new normal.
That reset is the question the rest of the report exists to test, and its mechanism is hiding in a number already on this page. The customer count reached about 54,600 at the end of 2025 — but the growth the market is now pricing does not assume that figure keeps climbing. It assumes the opposite. Why the unit that has always signaled network expansion is now set to shrink, and what part of the recent growth was borrowed from an acquisition, is where the story turns next in The Customer Count Break.
The Customer Count Break
The de-rating named a pivot without dwelling on it: the recurring-customer count, the number that for two decades read as a live measure of how far the network had spread. SPS reports its business on two disclosed dials — the count of recurring revenue customers and the average recurring revenue each one pays — and revenue is their product [1]. Through fiscal 2024 the two dials turned together, and the count did most of the storytelling: each new trading-partner connection SPS lit up on a retailer's behalf showed up as another customer on the network. In 2025 they came apart. The count leapt, then broke; the revenue-per-customer figure has carried the weight ever since. This act is about how that happened, what it leaves behind, and why today's forward estimates depend on a base that is now shrinking.
Two dials, moving together
SPS defines a recurring revenue customer as one with an active recurring contract at period end, and it labels the great majority "1P" — first-party brands, distributors and suppliers wired into a retailer's network — reserving "3P" for accounts whose only tie is an online-marketplace connection. The second dial, annual revenue per user (ARPU, the metric SPS used to call "wallet share"), is annualized recurring revenue divided by the average customer count [2].
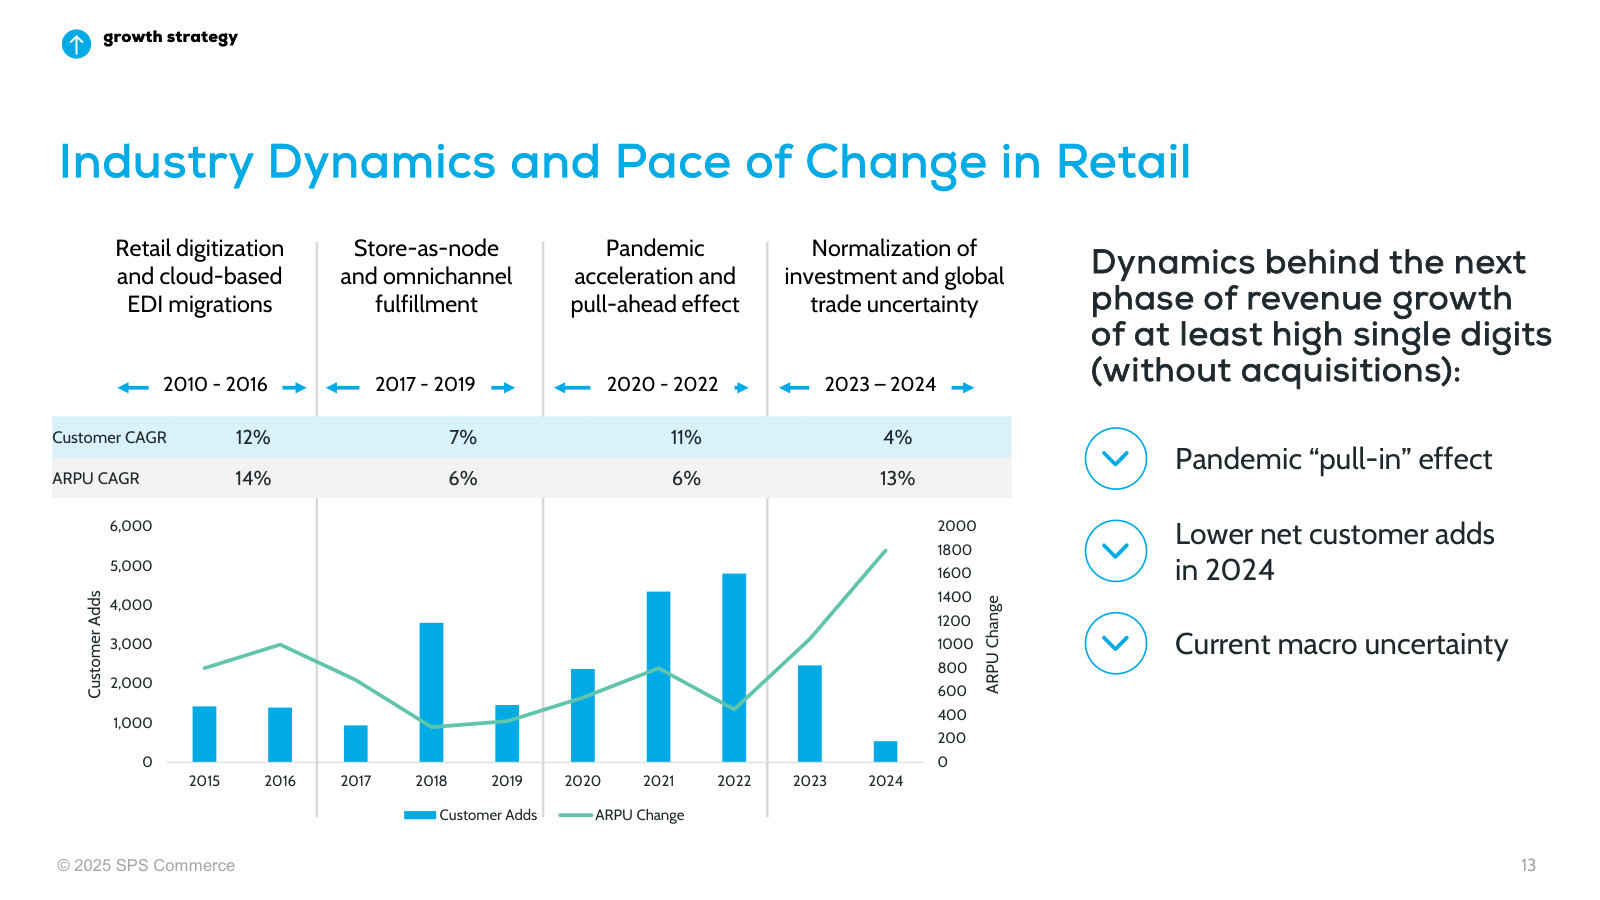
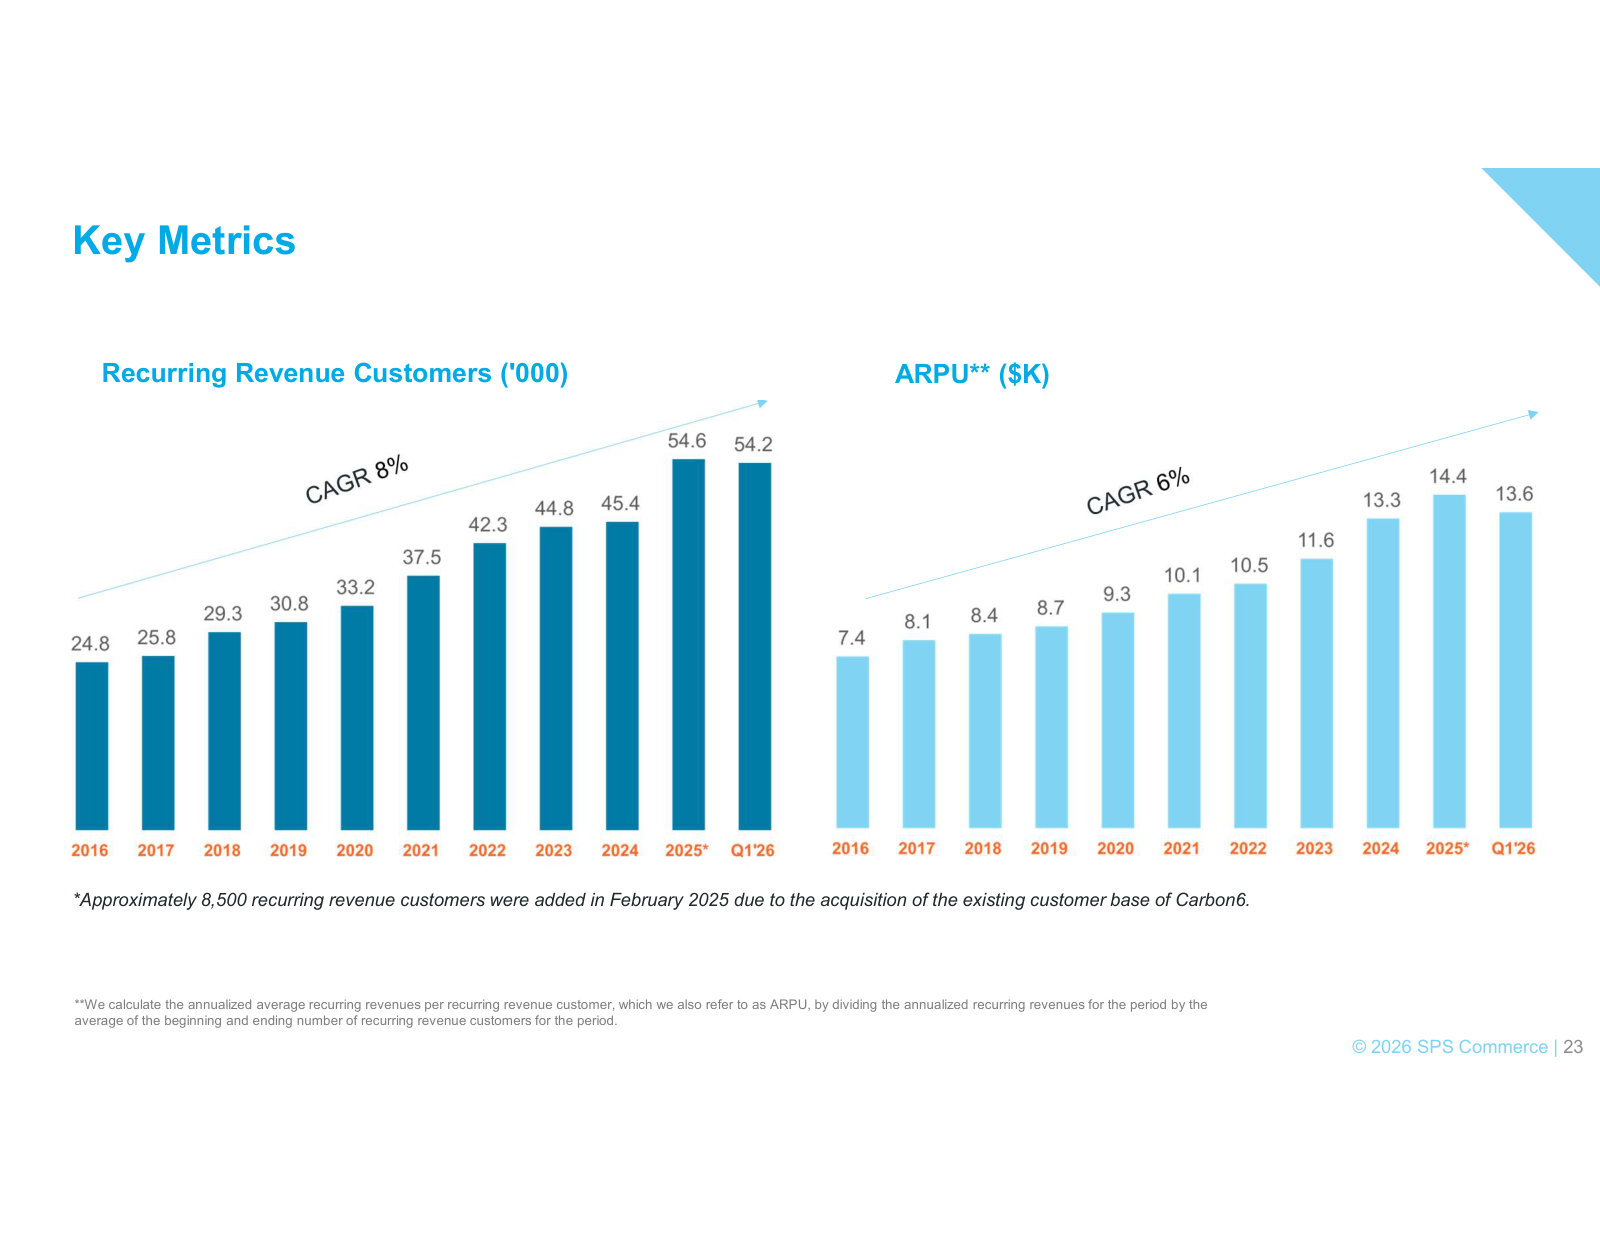
For most of the past decade both climbed in near-lockstep. Customers roughly doubled from 24,805 at the end of 2016 to 45,350 at the end of 2024; ARPU rose from about $7,344 to about $13,300 over the same span. Neither moved in jumps — the count added two-to-three thousand net customers a year through community-enablement campaigns, and ARPU stepped up as existing customers bought more of the product line.
Source: recurring-customer count and ARPU as reported in successive Forms 10-K; FY2025 figures per FY2025 10-K MD&A [3].
Nearly all of that revenue is recurring — about $718.0M of $751.5M in FY2025, of which Fulfillment (the core EDI product) is roughly 89% — so the customers-times-ARPU identity is not an abstraction. It is very nearly the whole income statement, and for years a reader could watch the network expand simply by watching the count.
The Carbon6 seam
In fiscal 2025 the count jumped 20%, from 45,350 to approximately 54,600 [4]. Set against the prior decade's two-to-three thousand a year, a jump of 9,250 looked like the flywheel spinning faster. Almost none of it was.
Of those net additions, roughly 8,500 arrived in a single month. SPS closed its acquisition of Carbon6 — a provider of software tools for Amazon sellers — in February 2025, and the deal brought over about 8,500 recurring revenue customers "of which approximately 300 are 1P recurring revenue customers and the remainder are 3P" [5]. Strip out Carbon6 and the organic base added on the order of 750 customers for the year — its slowest pace in a decade. The 20% headline and the underlying network grew almost nothing in common.
The seats also weighed on the second dial. Because Carbon6's Amazon-seller accounts pay far less than a typical 1P customer, adding roughly 8,200 of them mechanically pulled ARPU down: management put the full-quarter drag at "approximately $1,400" in the second quarter of 2025 alone [6]. So the two dials that had always turned together split in opposite directions: the count spiked on acquired volume while the price-per-customer it should have signaled fell. On the quarter it closed, management framed the deal as establishing "SPS as a clear leader in the emerging category of revenue recovery, supporting supplier communities of the two largest global retailers" [7].
That framing sat against a growth promise being quietly retired at the same time. As late as the third-quarter 2024 call, SPS still told investors it maintained "our annual revenue growth expectation of 15% or greater" [8]. Two quarters later the language changed: "beyond 2025, we expect our revenue growth rate, excluding future acquisitions to be at least high single digits" [9]. The multi-year algorithm — a round-number 15% that acquisitions had helped hit — was replaced by an organic frame roughly half as fast, in the same window the count was being padded with acquired seats.
Giving it back
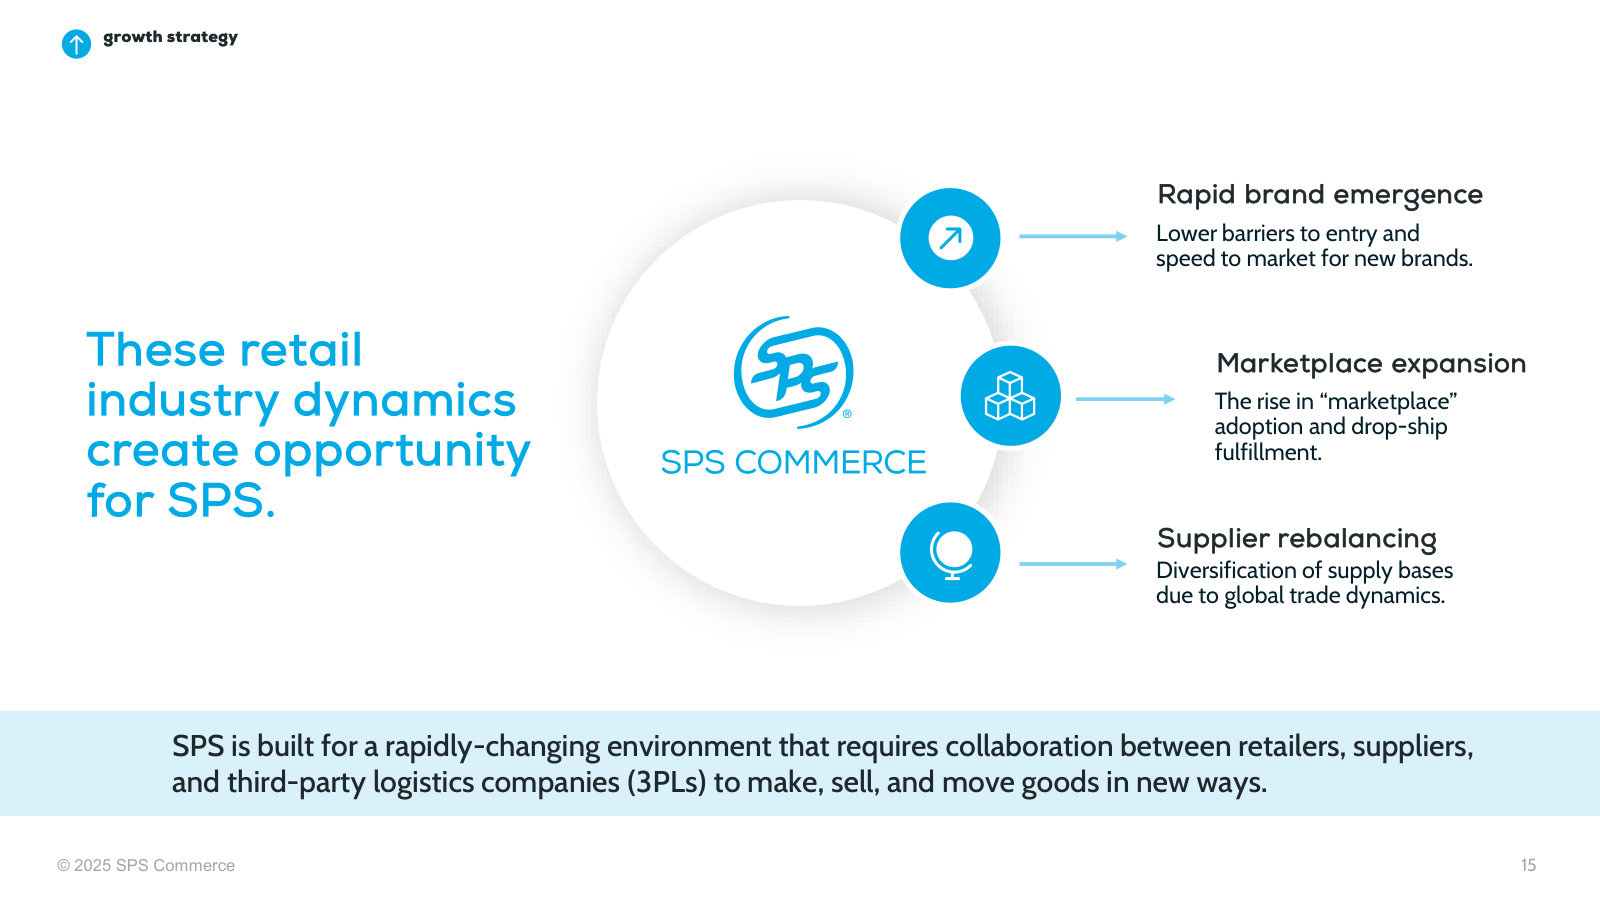
The seats did not stay. By the first quarter of 2026 SPS was managing them off deliberately: it introduced a subscription platform fee for its 3P take-rate accounts and told investors to expect "a projected decline of up to 4,000 3P suppliers in 2026," adding that it did "not anticipate this action to result in a material impact to revenue" [10]. A managed cull, in other words — the low-value cohort would be priced down to a smaller, better book.
One quarter later the plan was overtaken by a full exit. On June 30, 2026, SPS sold the entire 3P revenue-recovery business, received about $8.8 million in cash, and booked a loss of approximately $23.5 million; the same acquisition had cost $210.2 million in total consideration seventeen months earlier [11]. The divestiture removed "approximately 7,300 customers," dropping the recurring count to roughly 46,600, and because those were the lowest-ARPU accounts, their removal pushed ARPU the other way — up to about $15,100 [12]. After the sale, the network is once again entirely first-party: "all recurring revenue customers are classified as 1P" [13].
Customers added — Carbon6, Feb 2025
Customers removed — 3P divestiture, Jun 2026
Loss on sale ($M)
Sources: Carbon6 addition, FY2025 10-K [14]; divestiture customer reduction and loss, Q2 FY2026 call and 10-Q [15], [16].
Read as a round trip, the arithmetic almost cancels. Roughly 8,500 seats in, roughly 7,300 out; the count ended the second quarter of 2026 at about 46,600, barely above the 45,350 it left FY2024 at. What changed hands in between was $210 million of consideration, a $23.5 million book loss, and the "clear leadership" claim, retired within eighteen months of being made. The customer count that looked like a 20% expansion in 2025 was, on the network that matters, a wide detour back to roughly where it started.
The break, in one picture
The clearest way to see the seam is to put the two dials side by side across the years they diverged. The count spikes on Carbon6, then craters on the divestiture; ARPU never pauses.
Source: recurring-customer count as reported; FY2025 per 10-K MD&A [17]; Q2 2026 per Q2 FY2026 call [18].
Source: ARPU as reported; FY2025 per 10-K MD&A [19]; Q2 2026 per Q2 FY2026 call [20].
The count line now bends the wrong way for a network-effects story: the unit that historically signaled expansion has turned down. The ARPU line does the opposite, and its recent lift is partly cosmetic — removing the cheapest accounts raises the average of what remains without anyone buying more. Both moves trace to the same Carbon6 seam.
What is left when the seats clear
Underneath the detour, the core did not break — it was obscured by it. Asked what the business looks like without the Amazon piece, management was explicit: "if you remove Amazon revenue recovery from Q1, the rest of the business is already growing high single digits" [21]. The Fulfillment engine — roughly nine-tenths of recurring revenue — kept compounding through 2025; the reported growth rate was flattered on the way up by acquired seats and depressed on the way down as those seats churned and were sold, but the 1P network in the middle grew at a rate the headline never cleanly showed.
Precisely how much of the past growth was organic cannot be measured from the outside, because SPS does not measure it internally. In a 2024 response to an SEC comment, the company stated that it "monitors recurring revenue customers and wallet share as the primary metrics" and "does not actively track revenue broken out by new and existing customers" [22]. The one disclosed anchor is the acquisition pro-forma: had Carbon6 been owned for all of 2024, that year's revenue would have been about $680.9 million rather than the $637.8 million reported — roughly $43 million, or 6.8%, of acquired top line that the deal layered onto the comparison [23]. A reader can bound the organic run-rate — high single digits by management's own framing, a mid-single-digit forward consensus by the market's — but cannot pin it, and the company's own metrics are built the same way.
Where forward growth comes from
The reset is already in the numbers rather than only in the guidance. Consensus embeds forward revenue growth of about 5.3% — down from the 17.8% SPS delivered in FY2025 — and the first half of 2026 grew roughly 5.7%, so the step-down is realized, not projected. What keeps even that mid-single-digit figure positive is a specific arithmetic: with the count now falling year-on-year, the entire top line leans on ARPU. Consensus survives by pairing double-digit revenue-per-customer growth against a customer base that shrinks — the two dials that split in 2025 are now modeled to keep pointing in opposite directions, and only ARPU is additive.
Source: FY2025 growth as reported; H1 FY2026 from Q2 FY2026 results; FY2026 consensus per aggregated analyst estimates.
For a decade, network expansion and a rising customer count were the same fact, legible at a glance. They have come apart. The count can fall while the 1P base deepens — more products sold to the same trading partners — and that is what the recent ARPU lift, cosmetic component aside, is built to show. Whether richer wallet share on a slowly growing 1P base can stand in for the customer-count growth that used to do the work is the thread the rest of the report follows: first into the margin the full-service model earns on those relationships, and then to the people now deciding how the network's cash is spent.
The Hidden Margin
The wallet-share engine from The Customer Count Break earns a specific kind of margin, and it is an odd one. SPS keeps 69 cents of gross profit on every revenue dollar and converts a fifth of revenue to free cash — both competitive with a software peer set — yet its GAAP operating margin is 15.7%, a 724-basis-point gap below the peer median of 23.0% [1]. Three margins that should tell the same story about a scaled network tell three different ones. This chapter follows the money from gross profit down to operating income and out to cash, and shows that the gap is three things at once: a business-model choice, an accounting artifact, and reinvestment that has not yet turned into operating leverage.
Gross Margin (FY2025)
GAAP Operating Margin
Free Cash Flow Margin
Op-Margin Gap vs Peers
Sources: gross, operating and FCF margins per reported financials, FY2025; peer operating-margin gap vs the OTEX/MANH median [2].
What the 69 cents pays for
The profit-and-loss bridge is where the whole chapter lives. On $751.5 million of FY2025 revenue, cost of revenue took $231.6 million, leaving $519.9 million of gross profit — the 69% gross margin. From there, three operating lines and one non-cash line carry it down to $118.3 million of operating income [3].
Source: FY2025 Annual Report (Form 10-K), Results of Operations — figures in $M [4].
The important detail is what sits inside each line. Cost of revenue is not servers and bandwidth — it is people. The FY2025 increase came from $12.4 million of added personnel cost and $5.2 million of software subscriptions; the sales-and-marketing rise was $14.9 million of headcount plus channel-partner and referral fees; general-and-administrative growth was $15.2 million of headcount and third-party staff to integrate acquisitions [5]. Nearly every line that stands between gross profit and operating income is labor. A network that connects retailers and suppliers "once" is, underneath, a large services organization that onboards them, monitors their transactions, resolves exceptions, and optimizes the connections continuously [6].
The moat and the margin ceiling are one choice
That labor is not overhead to be engineered away. It is the product. Of the delivery methods for supply-chain integration laid out in Network, Marked Down, SPS built its position on the most service-heavy — full-service, where its teams carry the day-to-day operating burden on the customer's behalf. The distinction that carries the argument here is with the managed-service alternative, whose vendors develop the core technology but leave "the day-to-day customization, optimization, and operations of the technology" to the customer's own staff [7].
This is the same choice, read from two directions. From the moat side, doing the operating work is what makes a customer unwilling to leave: the switching cost is not a software license but an embedded team and two decades of compliance logic. From the margin side, doing the operating work is what puts a services organization between a 69% gross margin and operating income. The stickiness and the margin ceiling are bought with the same dollar.
The peer scoreboard shows the trade in numbers. SPS grew revenue 17.8% in FY2025 against a peer median of 3.7% — roughly five times the field, covered in Network, Marked Down — while earning 724 basis points less operating margin than that median. Manhattan Associates, whose product mix leans more on licensed software than on operated services, ran a 25.9% operating margin on 3.7% growth; OpenText, 20.1% [8]. SPS out-grows both and out-earns neither on this line. A full-service network converts its position into growth and retention rather than into peer-level operating margin.
Sources: SPS and OpenText operating margins and the acquired-intangible add-back from the FY2025 10-K [9]; Manhattan and peer-median operating margins per reported financials.
Where the leverage went
The chart already hints at the second cause. The bar marked "SPS ex-acquisition amortization" sits at 20.7%, level with OpenText and within reach of the median — because one of the four lines below gross profit is not an operating cost at all in the usual sense. It is the amortization of intangible assets created when SPS buys companies, and in FY2025 it was $37.2 million, a full 4.9% of revenue, booked as its own line inside operating expense [10].
That line is where the missing operating leverage went. Over five years, SPS's gross margin expanded 336 basis points, from 65.8% in FY2021 to 69.2% in FY2025 — real efficiency in the network's cost of service. Over the same five years, GAAP operating margin rose only 145 basis points, from 14.3% to 15.7%. The two numbers look like a company that cannot translate gross-margin gains into profit. They are not. Acquired-intangible amortization went from 2.6% of revenue in FY2021 to 4.9% in FY2025 — a 232-basis-point increase that absorbed roughly two-thirds of the gross-margin gain before it reached operating income [11].
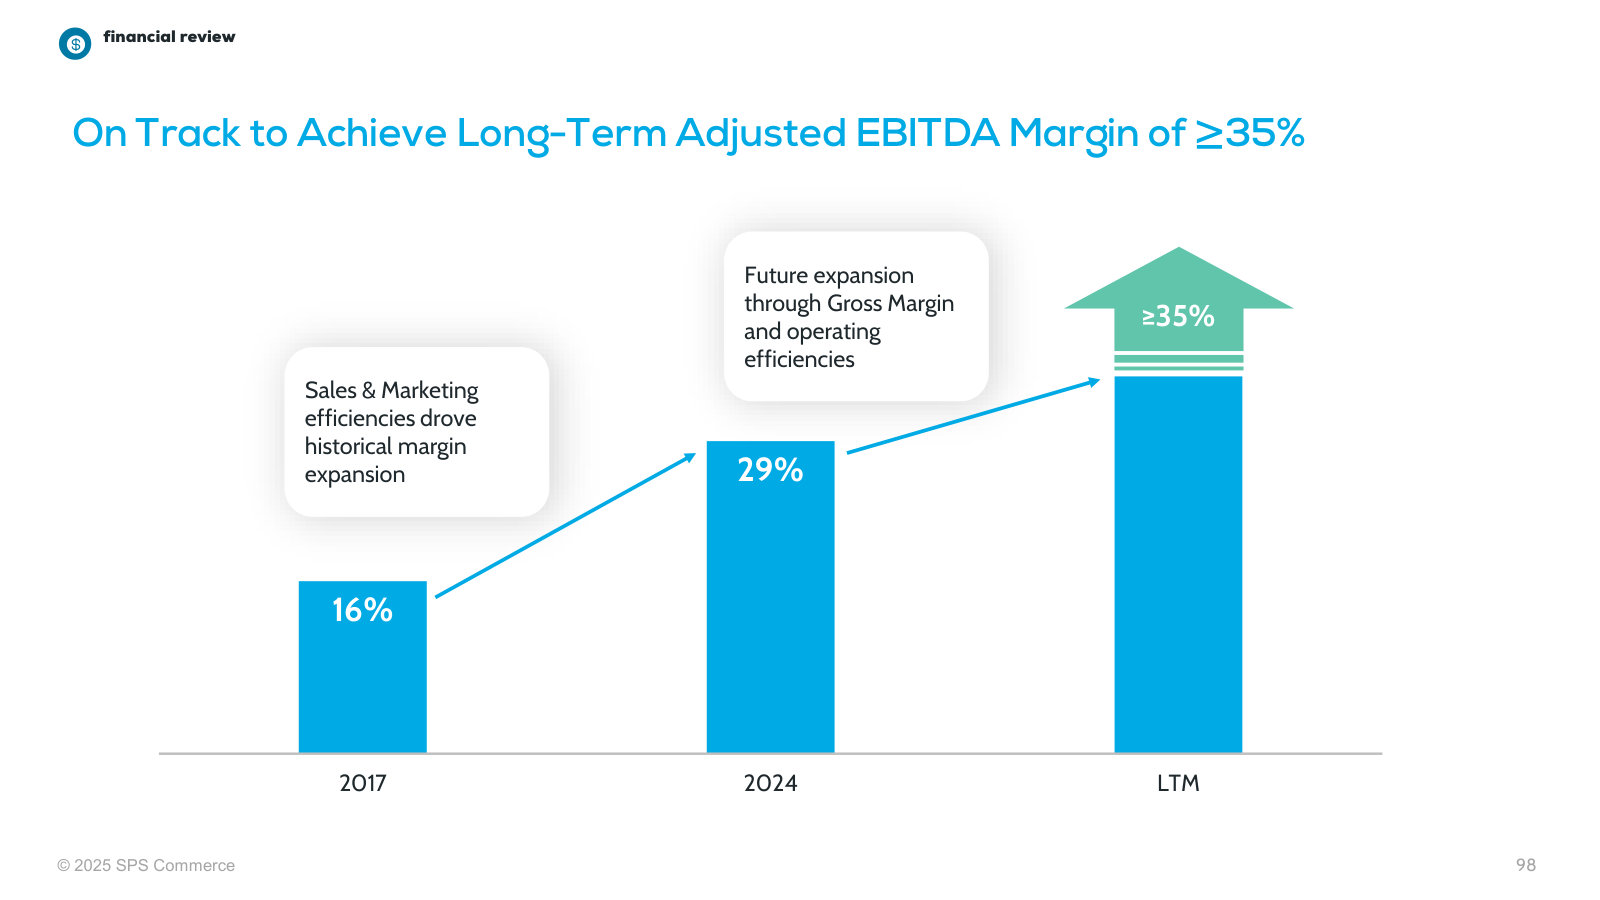
Strip that non-cash line out, and the leverage is there. Operating margin before acquired-intangible amortization rose from 16.9% to 20.7% across the period — a 376-basis-point gain that tracks the gross-margin expansion almost exactly. Management's own adjusted-EBITDA margin, which also removes the amortization, climbed from 28% to 31% [12]. The operating leverage the flat GAAP line seems to deny did emerge; it is hidden underneath an acquisition-accounting charge that grows with every deal.
Sources: gross and operating margins per reported financials, FY2021–FY2025; operating margin before acquired-intangible amortization derived by adding back the amortization line disclosed in the FY2025 10-K [13].
This is the direct answer to why the operating margin sits 724 basis points below the peer median. About 490 basis points of that gap is the acquired-intangible amortization line — a non-cash charge that reflects the price paid for companies like Carbon6 and SupplyPike, not the cost of running the network. The residual, roughly 230 basis points to the median and more against Manhattan's 25.9%, is the service-intensity of the full-service model plus reinvestment that has not yet scaled. The gap is real, but only part of it is operational, and the operational part is narrowing on a cash basis even as the reported line stays flat.
Clean cash, flattered headline
Follow the same dollars to cash and the picture flips to its most flattering. Operating cash flow was $178.8 million in FY2025 against $93.3 million of net income — 1.9 times — and the gap is legitimate non-cash and working-capital movement, not an accrual build [14]. Receivables grew no faster than revenue, and there is no inventory to distort the picture. Earnings turn into cash here about as cleanly as a subscription business can manage.
But the mechanism behind that clean conversion is worth naming, because it is also the source of the flattery. The largest single add-back bridging net income to cash is not depreciation — it is stock-based compensation, $53.7 million in FY2025, equal to 7.1% of revenue and larger than the $37.2 million of acquired-intangible amortization [15]. Free cash flow is struck after adding that back, so the 20.3% FCF margin treats a real cost of paying employees as if it were free. Net the stock compensation against reported free cash flow and the margin falls from about 20% toward 13% — still healthy, but a different number.
There is a second thing the headline waves past. The cash-flow statement shows "acquisition of business, net" of $142.6 million in FY2025, $147.9 million in FY2024 and $70.2 million in FY2023 — roughly $360 million of cash spent buying companies in three years, on top of the stock issued for them [16]. Free cash flow, defined as operating cash minus capital expenditure, excludes all of it. For a company whose customer additions and much of its recent revenue arrive through acquisition — Carbon6 alone cost $210.2 million [17] and lifted goodwill and intangibles to $757.5 million, about 65% of total assets [18] — treating acquisition spend as outside "free" cash flow overstates what is genuinely discretionary.
The cash-conversion and the accounting-flattery readings are both true at once. Cash conversion is clean — operating cash runs nearly twice net income with no receivables build. The same numbers are flattered — the 20% free-cash margin adds back a 7%-of-revenue stock-compensation cost and excludes roughly $140 million a year of recurring acquisition spend. Neither statement cancels the other.
One reconciliation note for anyone rebuilding these figures from the structured data feed: it records cash acquisitions of zero in every year, which the 10-K cash-flow statements directly contradict. The feed is wrong; the filing is right, and the acquisition spend above comes from the filing.
What management is targeting, and what would move it
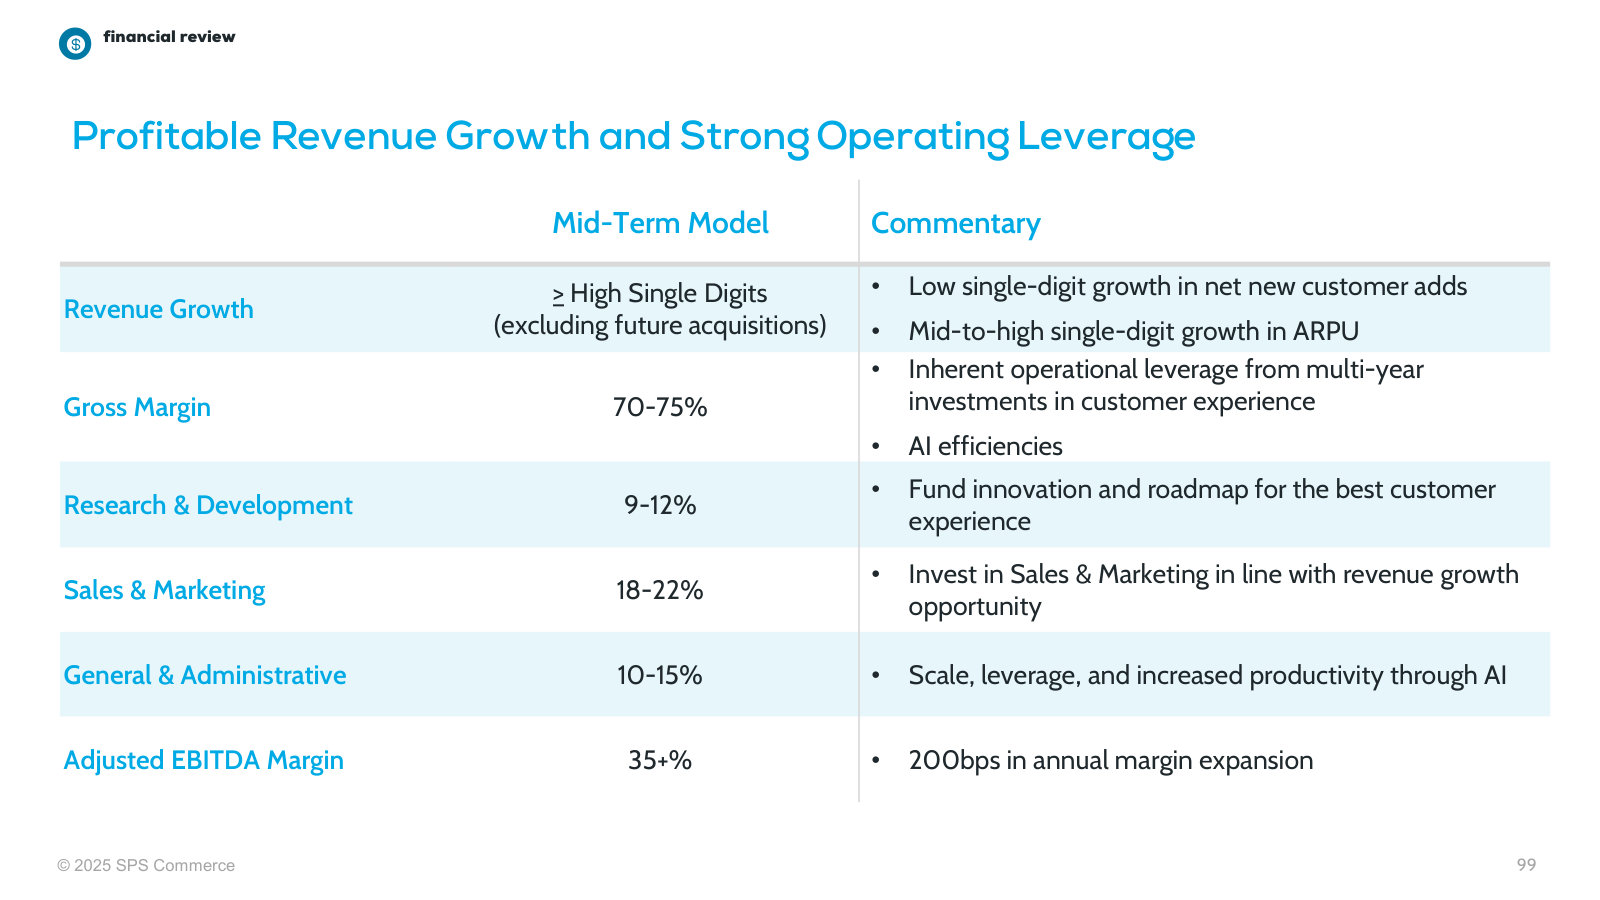
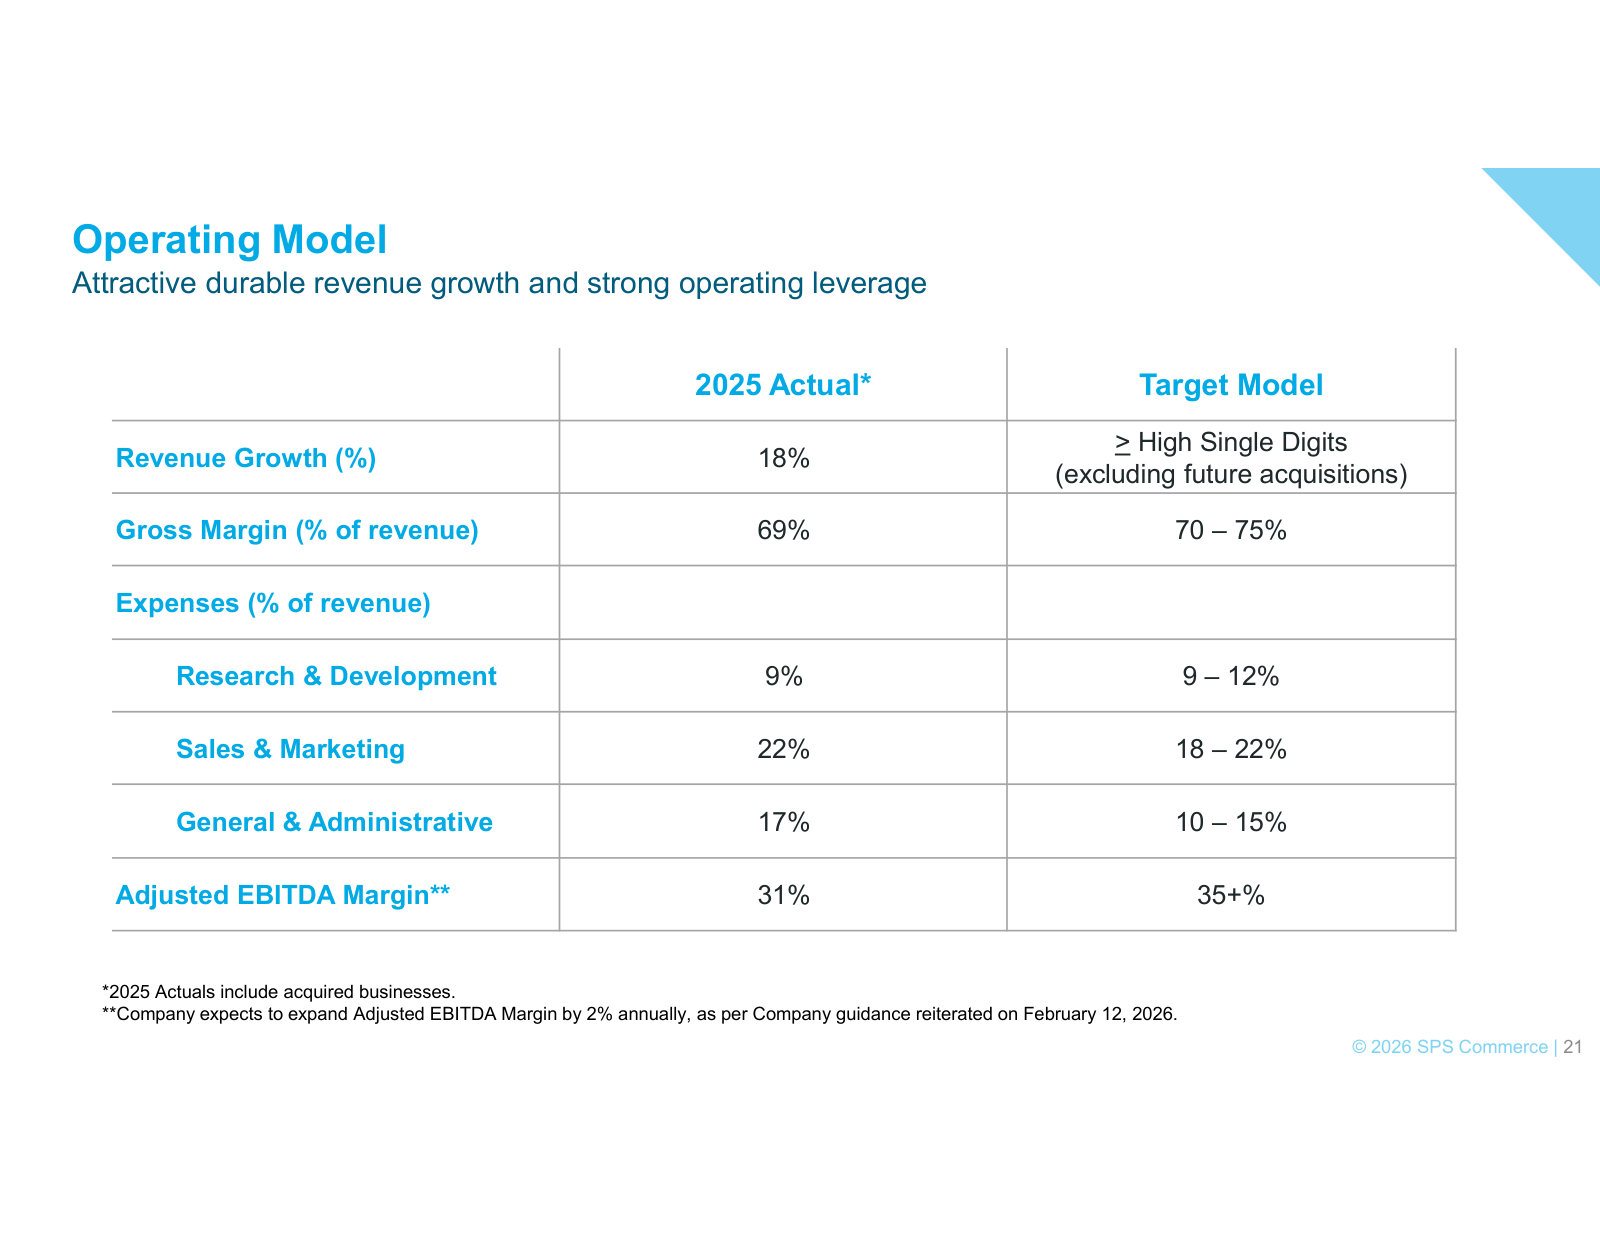
Management has published where it thinks the margin should land, and the table is a useful map of the gap. Against FY2025 actuals, the long-term operating model calls for gross margin of 70–75% (against 69% today), research and development of 9–12% (9% today, inside the band), sales and marketing of 18–22% (22% today, at the top of the band), general and administrative of 10–15% (17% today, well above it), and an adjusted-EBITDA margin of 35%-plus against 31% today, which the company expects to expand by about two points a year [19].
Source: Q1 FY2026 Investor Presentation, Operating Model [20].
The single line carrying most of the promised expansion is general and administrative, 17% of revenue against a 10–15% target — the widest gap in the table, and the one management attributes to the cost of closing and integrating acquisitions [21]. Sales and marketing is already at the top of its band, and research and development is inside its own. The margin-upside case, in other words, is largely a bet that general-and-administrative cost normalizes as the acquisition pace slows and the acquired businesses fold into the platform.
On the evidence here, the operating leverage is real but it is banked in cash, not yet in the GAAP line. Adjusted-EBITDA and pre-amortization operating margins have expanded roughly in step with gross margin; reported operating margin has not, because acquired-intangible amortization and general-and-administrative integration cost have grown alongside the deals that create them. The fact working against that read is that both offsets are recurring, not one-time: as long as SPS keeps acquiring, amortization keeps rising and integration keeps loading general-and-administrative expense, so the reported margin can stay depressed even while the underlying business scales. What would settle it is a stretch of quarters in which that expense falls toward its target band and adjusted-EBITDA margin advances its promised two points a year without a fresh deal resetting the clock — a line item and a threshold a reader can check each quarter.
That the amortization and the integration cost both trace back to acquisitions is not incidental. It puts the reader at the door of the chapter that follows: the same acquisitions that build the moat and depress the reported margin are a capital-allocation decision, made by a management team that has just turned over almost completely and is now spending record sums on buybacks rather than deals.
Capital After the Founder
The people deciding what SPS does with its cash are almost entirely new. Founder Archie Black, who ran the company from its start-up years through the IPO, handed the chief-executive seat to an outside hire in October 2023; the twenty-year chief financial officer is retiring in 2026, and the revenue and operating chiefs have already turned over. The team now holding the tiller has a short record — and what record it has splits cleanly by horizon: reliable on the near-term profit numbers it guides to, and repeatedly reset on the multi-year strategy promises it makes. That divide, and a capital account that has pivoted from deals to its own stock while the shares fell by two-thirds, is where the report closes.
New hands on the tiller
Chad Collins has served as chief executive and a director since October 2, 2023, hired from the warehouse-software company Körber/HighJump rather than promoted from within [1]. Kimberly Nelson, chief financial officer for nearly twenty years and a fixture from the IPO onward, announced her retirement; Joseph Del Preto — previously CFO of Sprout Social — took the role on March 16, 2026 [2]. The chief revenue officer and the president/COO of the founder era are also gone, and a new chief commercial officer, Eduardo Rosini, joined effective December 1, 2025 with a $1 million cash signing bonus [3]. A near-complete C-suite reshuffle inside roughly two and a half years coincides with the collapse the report opened on — the shares down 65.9% from their trailing three-year high.
The alignment between this team and the stock runs through the pay plan, not the share register. All current directors, nominees, and executive officers as a group — thirteen people — beneficially owned 215,960 shares as of March 30, 2026, an asterisk denoting less than one percent of the company; Collins himself held 22,754 shares [4]. The register is institutional: BlackRock alone holds 15.1% [5]. This is not a founder-controlled company where the operator's own net worth rides with the float; skin in the game here is annual equity grants, refreshed each year, not accumulated ownership.
The board mechanics around that pay are conventional and clean. The chief-executive and chair roles are separate — long-tenured director Philip Soran has held the independent-chair title only since May 2024 — and eight of nine director nominees are independent, with only Collins inside [6]. The board itself refreshed heavily: four of the nine nominees — Chima, Gaurav, McConnell, and Partin — joined in 2025 or 2026, and two of them, Chima and McConnell, were put forward under a February 12, 2026 cooperation agreement with the activist investor Anson Funds Management [7]. The same engagement surfaces again in the capital account below, because the buyback authorization stepped up in the same week.
A record that splits by horizon
On profitability, the new team keeps its word. Management has committed to expanding the adjusted-EBITDA margin by two percentage points a year, reiterated that pledge on the FY2025 call, and delivered: the FY2025 EBITDA guide held even as revenue slipped, landing at roughly $231 million [8]. Revenue itself finished at $751.5 million, below the $758–763 million guided a year earlier, while the profit line came in on plan — the pattern in miniature: the growth promise slipped, the margin promise held.
On multi-year strategy, the record is the reverse. The signature capital decision of the Collins era was Carbon6, acquired in early 2025 and framed on that quarter's call as establishing "SPS as a clear leader in the emerging category of revenue recovery." The entire third-party Amazon-seller business that Carbon6 brought was divested at a $23.5 million loss on sale — reversed at a realized loss inside roughly eighteen months of being announced as leadership [9]. The mechanics of how that acquisition flattered and then subtracted from the customer count are the subject of The Customer Count Break; what matters here is the judgment it reveals. The founder-era blueprint was explicit that deals would be "tuck-in type acquisitions" of add-on products for the recurring base, not company-defining bets — Black told investors as much on the Q4 FY2021 call [10]. The one large deviation from that blueprint is the deal that was undone.
Where the cash actually went
Underneath the strategy narrative, the cash tells its own story, and for most of the past decade it was an M&A story. SPS routed the large majority of its surplus into buying businesses. Goodwill — the premium paid over the tangible worth of what was acquired — rose from $134.9 million at the end of FY2020 to $541.7 million at the end of FY2025, roughly quadrupling, with no impairment ever recorded [11].
Source: FY2025 Annual Report (Form 10-K), Consolidated Balance Sheets; goodwill line item of $541,719 thousand at year-end 2025, and prior 10-K balance sheets [12].
The step-up was not gradual. The two largest deals in company history closed within eighteen months of each other: SupplyPike, effective July 2024, at $211.9 million total consideration, and Carbon6, effective February 2025, at $212.5 million [13]. Each was roughly 64% goodwill — $133.8 million and $136.3 million respectively — and each was partly paid in the company's own shares, $87.2 million and $67.7 million of equity consideration [14]. More of the balance sheet is now acquisition-derived intangible value than at any prior point, and none of it has been tested by a downturn.
SPS funds all of this without leverage. The company carries no debt and pays no dividend; it financed FY2025's combined $142.6 million of acquisitions and $114.3 million of buybacks by drawing its own cash balance down and letting its investment portfolio mature [15]. That all-equity, self-funding policy has a practical consequence for the future: a deal materially larger than SupplyPike or Carbon6 would require the company to raise debt or issue equity for the first time — a capital-structure decision this management has never had to make.
The buyback pivot
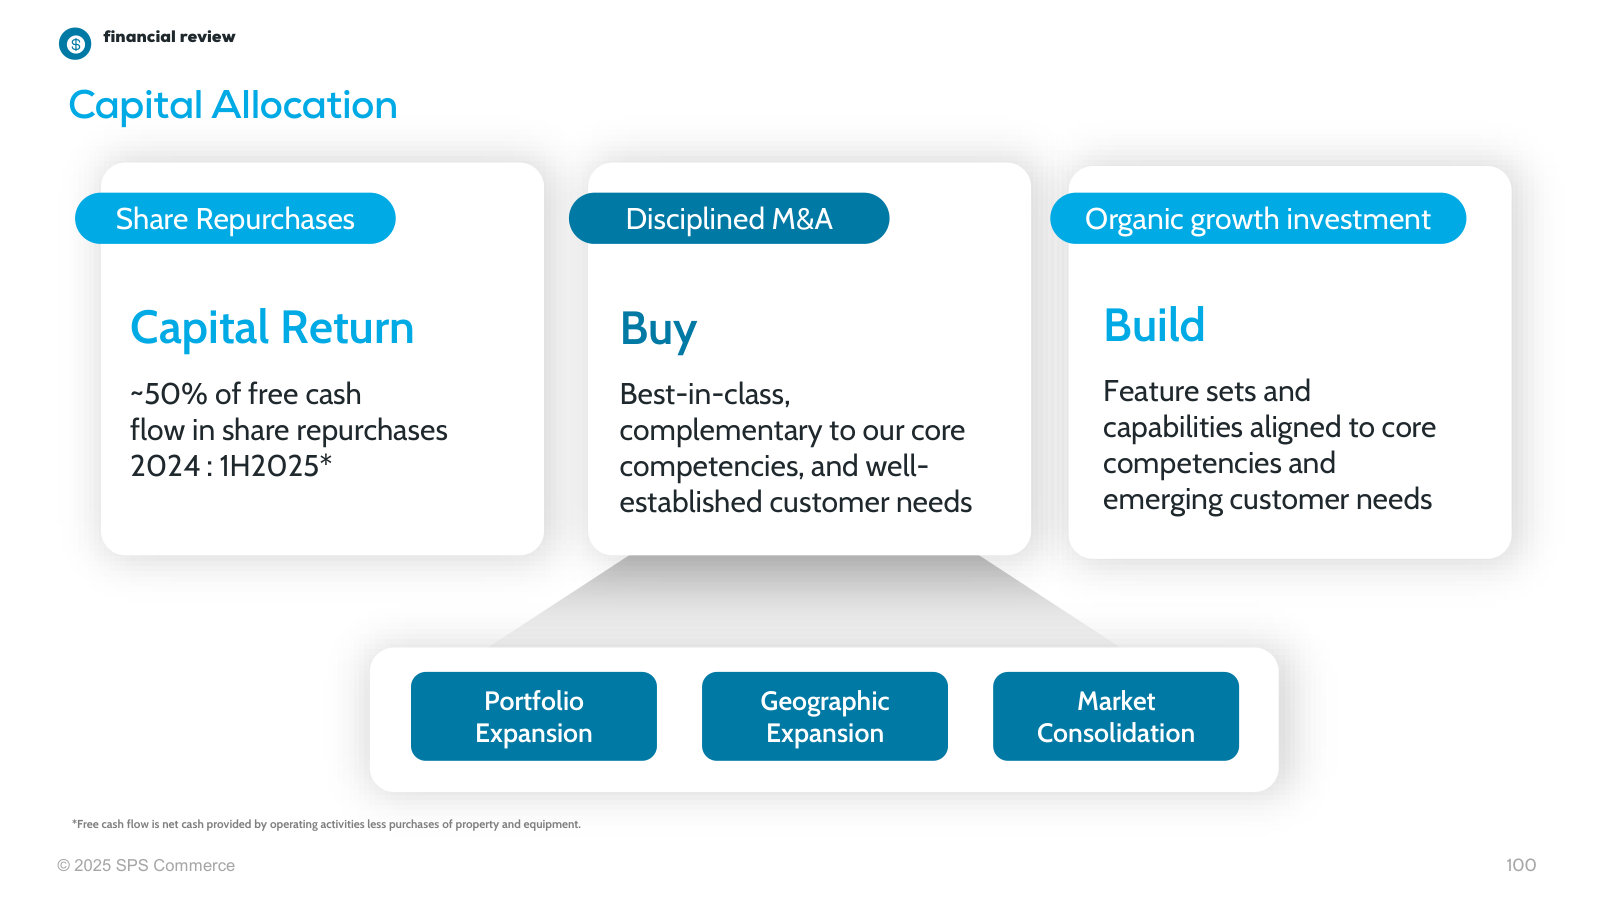
As the growth algorithm reset, the cash turned toward the stock. Repurchases went from zero in FY2023 to $37.6 million in FY2024 to $114.3 million in FY2025 [16]. The authorization behind them was raised three times — $100 million in July 2024, another $100 million in October 2025, and an added $200 million in February 2026, for $300 million in standing capacity [17]. That last increase landed in the same week as the Anson cooperation agreement. The buying accelerated into the fall of the stock: by Q2 FY2026 the company was deploying nearly 90% of its free cash flow — $51.2 million in the quarter — to repurchases [18].
Source: FY2025 Annual Report (Form 10-K), Consolidated Statements of Cash Flows — acquisition of business and repurchases of common stock [19].
What the repurchases have not done is shrink the company. Diluted shares outstanding rose every year through the buyback escalation — from 37.48 million in FY2023 to 37.99 million in FY2025 — because the repurchases have run at roughly the pace of stock-based compensation, and the shares SPS bought back were reissued as the equity currency for SupplyPike and Carbon6 [20]. In FY2025, buybacks of $114.3 million sat against $53.7 million of stock compensation; in the two years before, when repurchases were smaller, the compensation add-back exceeded them outright.
Source: FY2025 Annual Report (Form 10-K), Consolidated Statements of Cash Flows — stock-based compensation and share repurchases [21].
The framing shifted with the spending. On the Q1 FY2026 call, Collins told investors that "the most efficient use of our capital today is buying back shares," relegating M&A to "the long term" across three areas [22]. For a company whose cash account had been an M&A account for a decade, that is a genuine reprioritization — and it arrived alongside the deepest part of the drawdown and an enlarged authorization, not in calmer conditions.
Two reads of the same price
The pay plan bites, which is a point in its favor. More than 80% of target executive compensation is long-term equity [23]; the performance shares vest on three-year total shareholder return relative to the Russell 2000, and the annual cash bonus runs off a revenue-and-EBITDA matrix [24]. For 2025, that matrix paid zero: the minimum revenue threshold of $752.9 million was not met, and so no formula bonus was earned by the chief executive or the other named officers — even though reported revenue still grew 17.8% [25]. The internal targets sat above the outcome the market ultimately punished, and the board did not paper over the miss.
Against that backdrop, two informed parties are reading the same price in opposite directions. The sell side has converged its price targets down to the stock: the consensus target mean of $72.73 sits essentially at the $73.39 spot, with the median below it and eight of the covering analysts rated hold — targets that endorse the de-rated price rather than model a recovery. Management, meanwhile, is spending a record sum buying the same shares, as though the de-rating overshot.
Spot Price (2026-07-31)
Sell-Side Target Mean
FY2025 Buybacks ($M)
Diluted Shares YoY
Sources: consensus targets and price from reported market data; buybacks and share count from FY2025 Annual Report (Form 10-K), Consolidated Statements of Cash Flows — repurchases of common stock [26].
At the low, management is asking investors to underwrite a specific forward story: that 2025's weakness was "more one-time in nature," that revenue growth inflects in the back half of 2026, and that AI-enabled products lift revenue per customer by an amount it has declined to quantify [27]. That is the same class of multi-year claim the recent record cautions against taking on faith — the 15%-growth framework, the European expansion, the "clear leadership" in revenue recovery were each stated and then dropped or reversed. The near-term margin commitments that sit beside those claims have, by contrast, been kept.
This is where the report's open thread comes to rest rather than resolves. Whether this founder-exited team can produce the per-share result without leaning on either M&A or buybacks is the capital-allocation question this chapter leaves open, and the evidence a reader can hold that team to is dated and checkable: whether diluted shares finally fall as the $300 million authorization is spent, rather than merely offsetting compensation and funding deals; whether the promised organic reacceleration shows up in the reported top line in the back half of 2026; whether the two platform acquisitions ever take a goodwill impairment; and whether a larger deal forces the first debt or equity raise in the company's history. Those four lines will settle which of the two reads of the price was right.
The numbers behind SPS Commerce, Inc.: as-reported financial statements and company metrics for FY2021–FY2025, traced to the source filings, opened with the share-price history those statements have to justify. Every linked figure opens the exact page of the filing it was printed on, with the statement row highlighted. Amounts in US$ thousands unless noted.
Reading notes: All figures are in thousands of U.S. dollars as printed in SPS Commerce's Form 10-K and Form 10-Q filings (per-share amounts in dollars). Fiscal year ends December 31. FY2021-FY2025 statement figures are verified against, and cited to, each year's own Form 10-K (the income statement and cash-flow statement each present three years; the balance sheet two years). FY2016-FY2020 long-term-record figures are taken from the standardized data feed (SEC XBRL) and shown without page links. The corpus index describes the FY2021 10-K as covering 'the fiscal year ended December 31, 2020'; this is an index error - the filing itself reports fiscal year ended December 31, 2021 (revenues of $385.3 million), consistent with the feed and the FY2022 comparative column.
Share Price — Full Available History — 16 Years
The stock closed at $73.39 on Jul 31, 2026 — up 2,059% over the window shown (+20.8% a year), trading between $2.15 and $215.42. At that close the stock trades at 30× FY2025 diluted EPS as reported below.
Source: market price feed, monthly closes, sampled from 4,095 source observations, Apr 2010–Jul 2026. Price return only, excludes dividends. Prices are split-adjusted (1:2 on Aug 23, 2019).
Market capitalization $2.8bn.
Market cap = 38.0M shares outstanding × the Jul 31, 2026 close of $73.39. Market-derived, shown without filing links.
FY2025 at a Glance
Revenue (US$ thousands)
Net income (US$ thousands)
Diluted EPS
Source: FY2025 consolidated statements [1] [2] [3] [4]. Click any linked figure to open the filing page with the row highlighted.
Revenue by Product
| Revenue by Product | FY2021 | FY2022 | FY2023 | FY2024 | FY2025 |
|---|---|---|---|---|---|
| Fulfillment | 306,851 | 364,148 | 436,702 | 523,704 | 637,648 |
| Analytics | 42,674 | 46,894 | 51,703 | 55,717 | 56,017 |
| Other | 5,481 | 8,005 | 13,608 | 20,668 | 24,310 |
| Recurring revenues | 355,006 | 419,047 | 502,013 | 600,089 | 717,975 |
| One-time revenues | 30,270 | 31,828 | 34,897 | 37,676 | 33,530 |
| Total revenue | 385,276 | 450,875 | 536,910 | 637,765 | 751,505 |
| Total revenue growth, derived | — | +17.0% | +19.1% | +18.8% | +17.8% |
Source: Note C - Revenue (revenue disaggregation by stream) [5] [6] [7] [8]. Click any linked figure to open the filing page with the row highlighted.
Income Statement
Source: Consolidated Statements of Comprehensive Income [1] [2] [3] [4]. Click any linked figure to open the filing page with the row highlighted.
Columns marked E are consensus analyst estimates from S&P Capital IQ (CapIQ), shown alongside reported results for direct comparison; they are not company guidance.
Estimate source: S&P Capital IQ (CapIQ) consensus, as of 2026-08-02. Estimate figures are S&P Capital IQ consensus (vendor data — no filing page links). EPS and net income use the normalized (adjusted) consensus where the street reports it. Line-item analyst models (segments, drivers, KPIs) are in the Visible Alpha tab.
Balance Sheet
Source: Consolidated Balance Sheets [9] [10] [11] [12]. Click any linked figure to open the filing page with the row highlighted.
Cash Flow
Source: Consolidated Statements of Cash Flows [13] [14] [15] [16]. Click any linked figure to open the filing page with the row highlighted.
Network Scale and Customer Economics
| Network Scale and Customer Economics | FY2021 | FY2022 | FY2023 | FY2024 | FY2025 |
|---|---|---|---|---|---|
| Recurring revenue customers | 37,500 | 42,300 | 44,800 | 45,350 | 54,600 |
| 1P recurring revenue customers | — | — | — | — | 46,900 |
| Wallet share / ARPU (US$ per customer) | 10,050 | 10,500 | 11,550 | 13,300 | 14,350 |
| Recurring revenues (% of total revenue) | 92% | 93% | 94% | 94% | 96% |
| Consecutive quarters of revenue growth | 84 | 88 | 92 | 96 | 100 |
Source: company filings [17] [18] [19] [20]. Click any linked figure to open the filing page with the row highlighted.
Profitability (Non-GAAP, As Reported)
| Profitability (Non-GAAP, As Reported) | FY2021 | FY2022 | FY2023 | FY2024 | FY2025 |
|---|---|---|---|---|---|
| Adjusted EBITDA | 107,015 | 132,268 | 157,630 | 186,631 | 231,367 |
| Adjusted EBITDA margin | 28% | 29% | 29% | 29% | 31% |
| GAAP margin (net income / revenue, as reported) | 12% | 12% | 12% | 12% | 12% |
Source: company filings [21] [22] [23] [24]. Click any linked figure to open the filing page with the row highlighted.
Workforce
| Workforce | FY2021 | FY2022 | FY2023 | FY2024 | FY2025 |
|---|---|---|---|---|---|
| Total employees | 1,901 | 2,215 | 2,489 | 2,783 | 2,948 |
| Employees - cost of revenues | 959 | 1,122 | 1,238 | 1,355 | — |
| Employees - sales and marketing | 460 | 557 | 644 | 733 | — |
| Employees - research and development | 332 | 359 | 402 | 461 | — |
| Employees - general and administrative | 150 | 177 | 205 | 234 | — |
Source: company filings [25] [26] [27] [28]. Click any linked figure to open the filing page with the row highlighted.
Long-Term Record
| Fiscal year | Total revenue | Income from operations | Net income | Diluted EPS | Operating cash flow | Capital expenditures |
|---|---|---|---|---|---|---|
| FY2016 | 193,153 | 6,385 | 4,963 | 0.29 | 18,765 | (8,008) |
| FY2017 | 220,085 | 9,981 | 351 | 0.01 | 31,050 | (7,271) |
| FY2018 | 248,240 | 26,731 | 23,872 | 0.68 | 55,015 | (13,750) |
| FY2019 | 279,124 | 38,406 | 33,712 | 0.94 | 71,794 | (13,585) |
| FY2020 | 312,630 | 50,158 | 45,586 | 1.26 | 88,562 | (16,467) |
| FY2021 | 385,276 | 55,085 | 44,597 | 1.21 | 112,893 | (19,588) |
| FY2022 | 450,875 | 71,182 | 55,134 | 1.49 | 100,052 | (19,880) |
| FY2023 | 536,910 | 77,248 | 65,824 | 1.76 | 132,298 | (19,761) |
| FY2024 | 637,765 | 88,883 | 77,054 | 2.04 | 157,398 | (20,046) |
| FY2025 | 751,505 | 118,303 | 93,339 | 2.46 | 178,790 | (26,524) |
Source: consolidated statements across filings; older years from the standardized feed [13] [1] [14] [2]. Click any linked figure to open the filing page with the row highlighted.
Analyst Consensus
Mean target
Median target
High target
Low target
Street ratings: 2 strong buy, 1 buy, 8 hold, 1 strong sell. Consensus: Hold.
Estimate source: S&P Capital IQ (CapIQ) consensus, as of 2026-08-02. Estimate figures are S&P Capital IQ consensus (vendor data — no filing page links). EPS and net income use the normalized (adjusted) consensus where the street reports it. Line-item analyst models (segments, drivers, KPIs) are in the Visible Alpha tab.
Traceability
361 of 391 figures on this page (92%) link to the filing page where they are printed — click a linked figure to open the source PDF at that page with the row highlighted. Unlinked figures come from standardized data feeds or pre-filing years.
All figures are in thousands of U.S. dollars as printed in SPS Commerce's Form 10-K and Form 10-Q filings (per-share amounts in dollars). Fiscal year ends December 31.
FY2021-FY2025 statement figures are verified against, and cited to, each year's own Form 10-K (the income statement and cash-flow statement each present three years; the balance sheet two years).
FY2016-FY2020 long-term-record figures are taken from the standardized data feed (SEC XBRL) and shown without page links.
The corpus index describes the FY2021 10-K as covering 'the fiscal year ended December 31, 2020'; this is an index error - the filing itself reports fiscal year ended December 31, 2021 (revenues of $385.3 million), consistent with the feed and the FY2022 comparative column.
Revenue is disaggregated in Note C into recurring streams (Fulfillment, Analytics, Other) and One-time revenues; recurring revenue was 95-96% of total across FY2021-FY2025.
Cash-flow line label 'Acquisition of businesses, net' varies slightly by filing (e.g. 'Acquisition of business and intangible assets, net' in the FY2021 10-K, 'Acquisitions of businesses, net' in FY2022); each citation quotes the verbatim label from that filing.
Quarterly: Q1 FY25-Q1 FY26. Single-quarter income and point-in-time balance sheets are as printed in each 10-Q. The Q4 FY25 income column is derived from the FY2025 10-K full-year statement less the Q3 nine-month figure (reconciles exactly). Single-quarter operating cash flow and capex are derived from the printed year-to-date statements. No stock split occurred in the window (eps_split_adjusted=false).
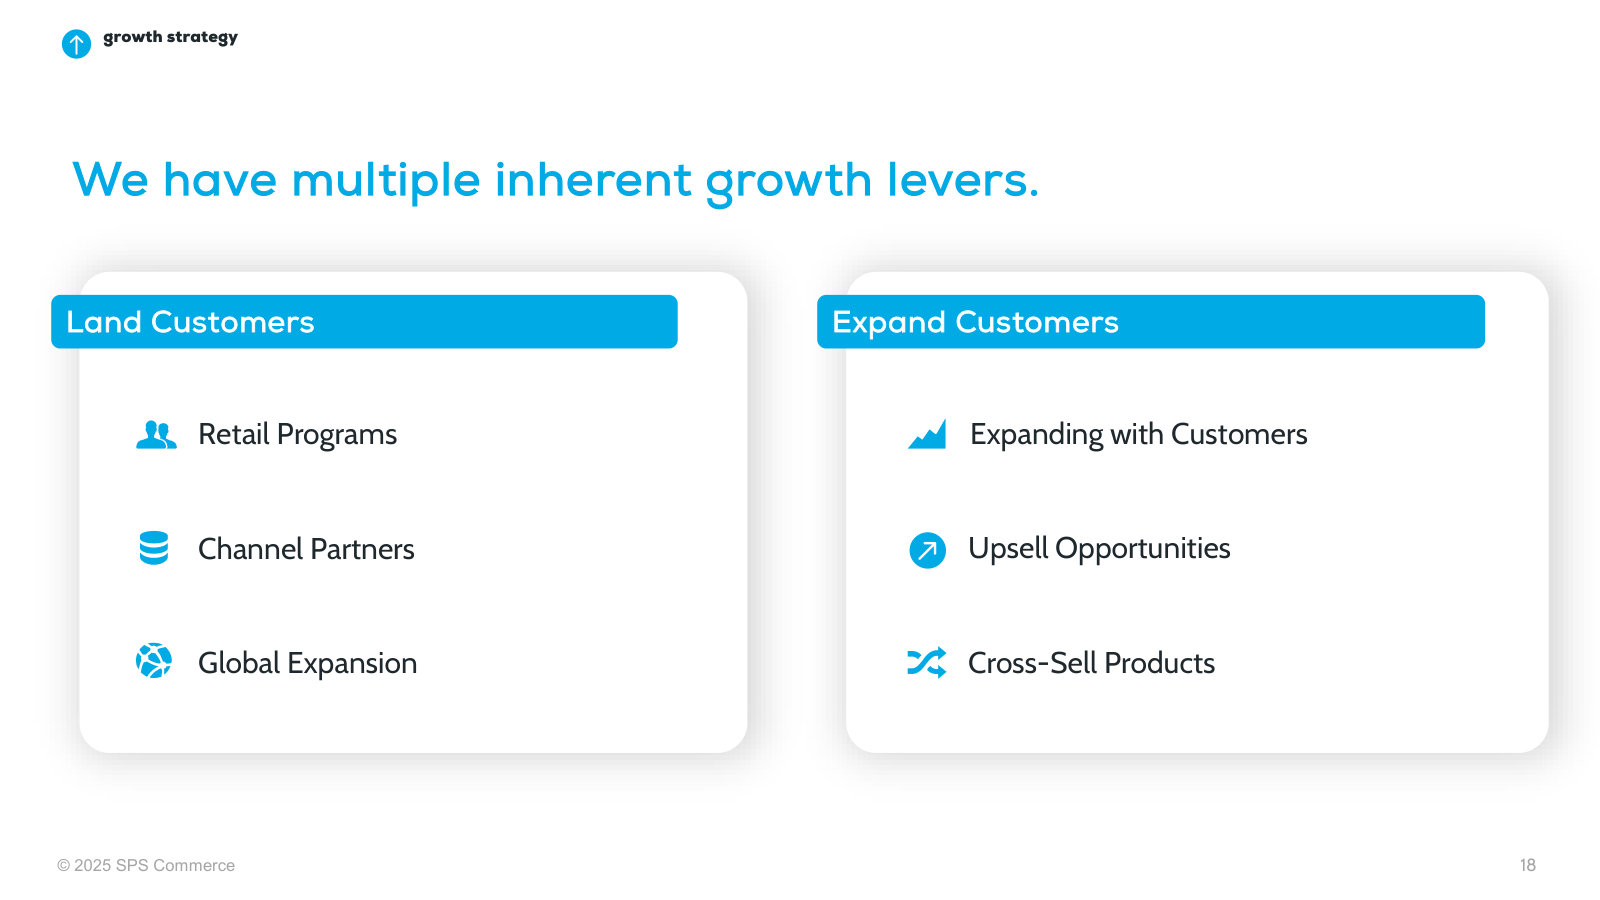
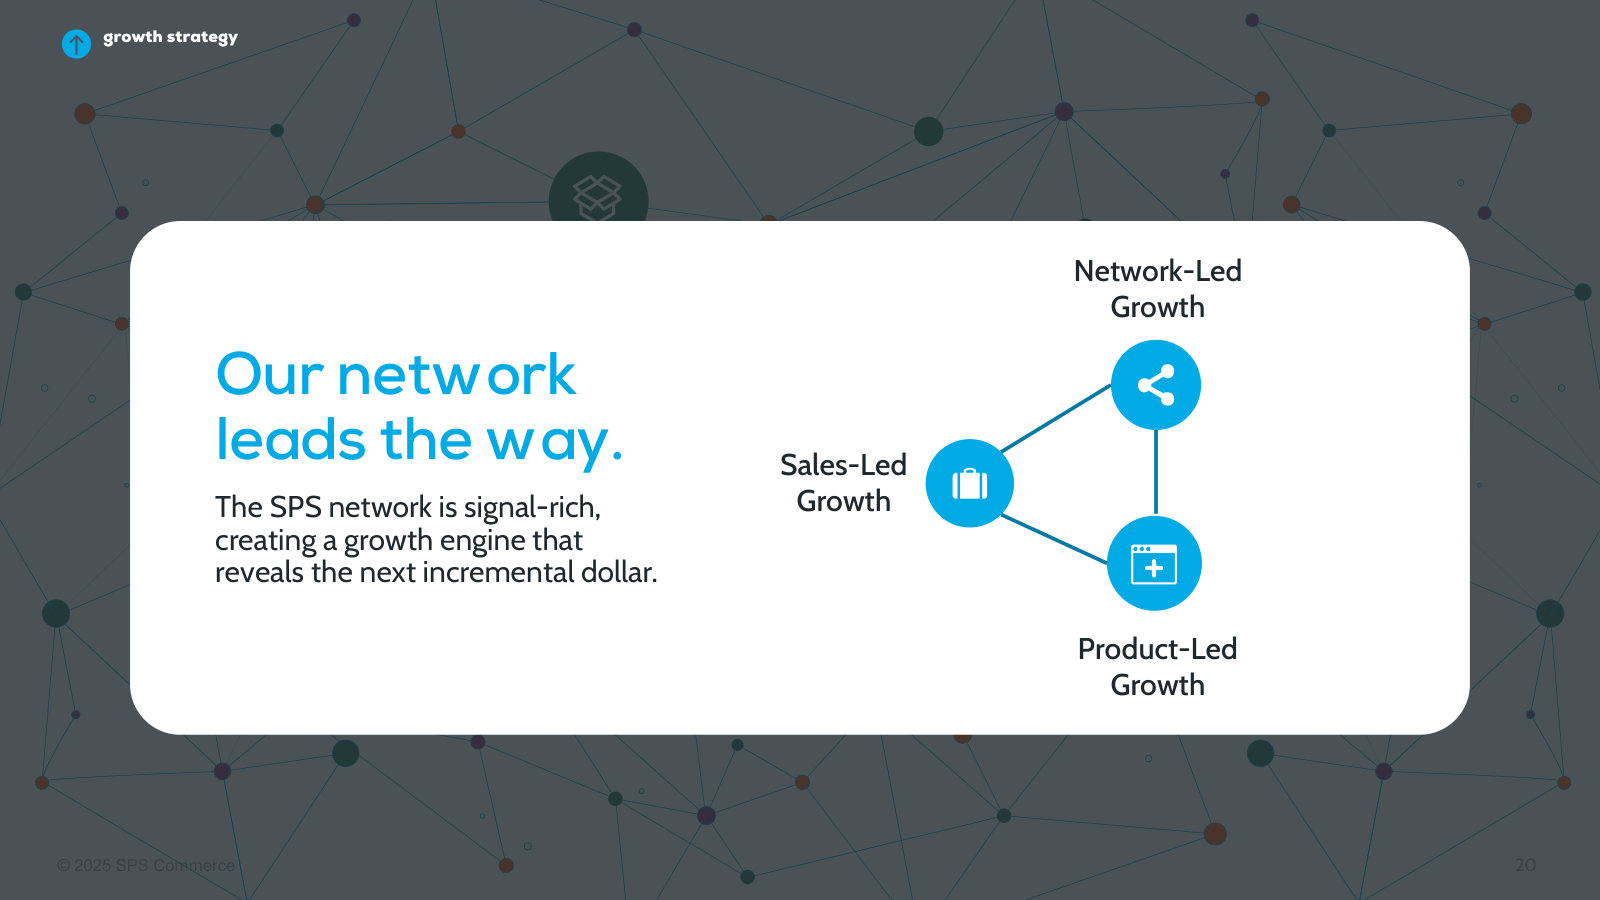
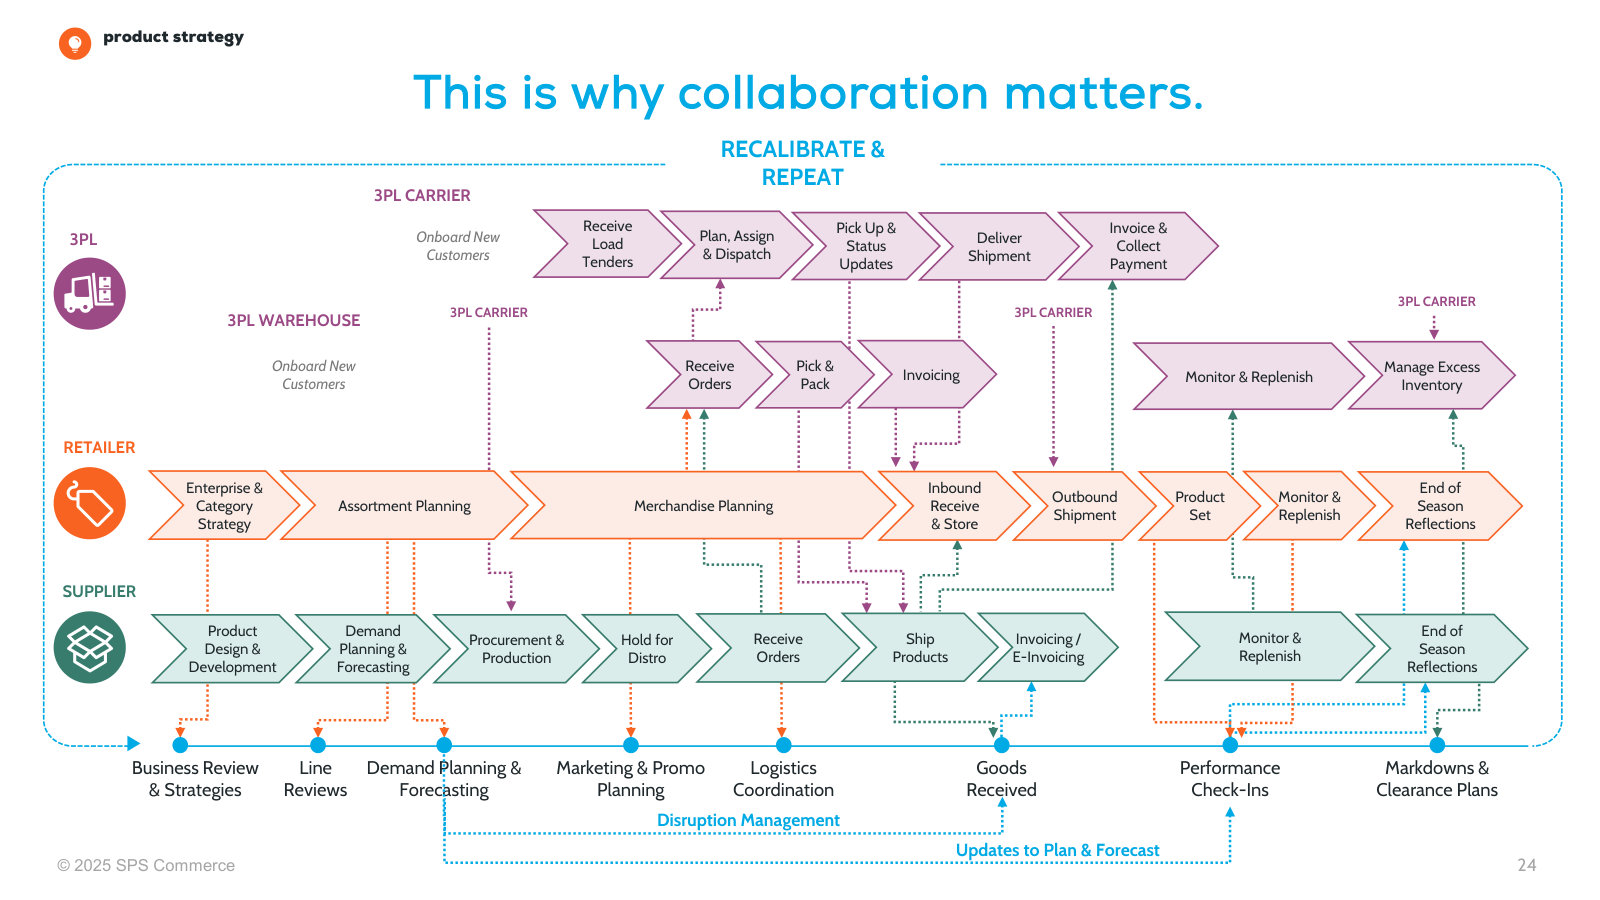
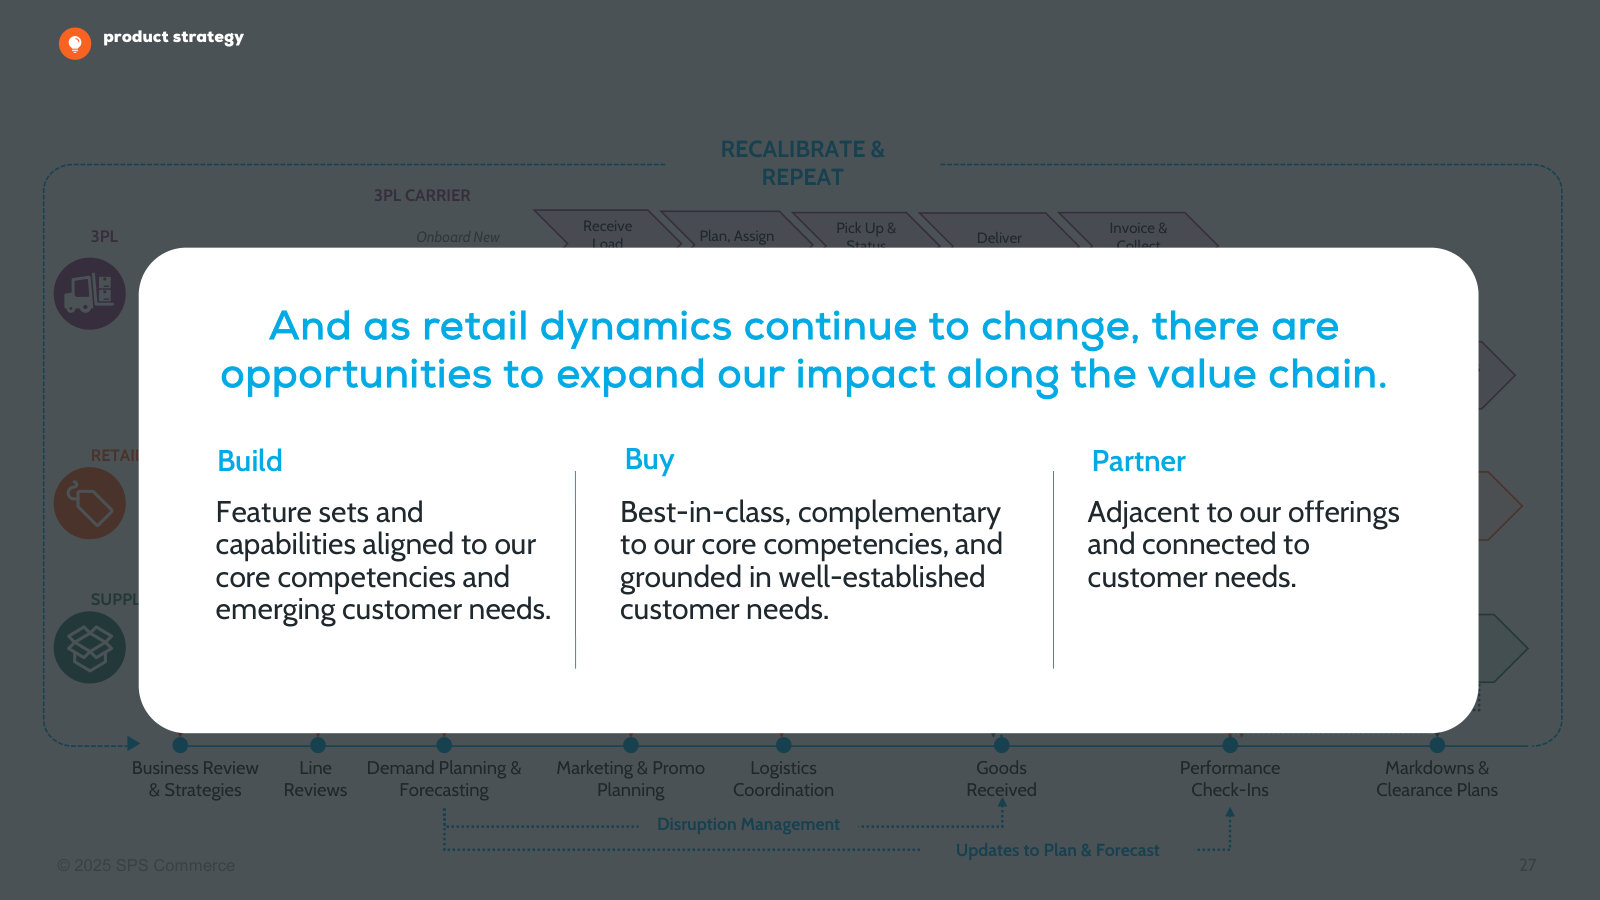
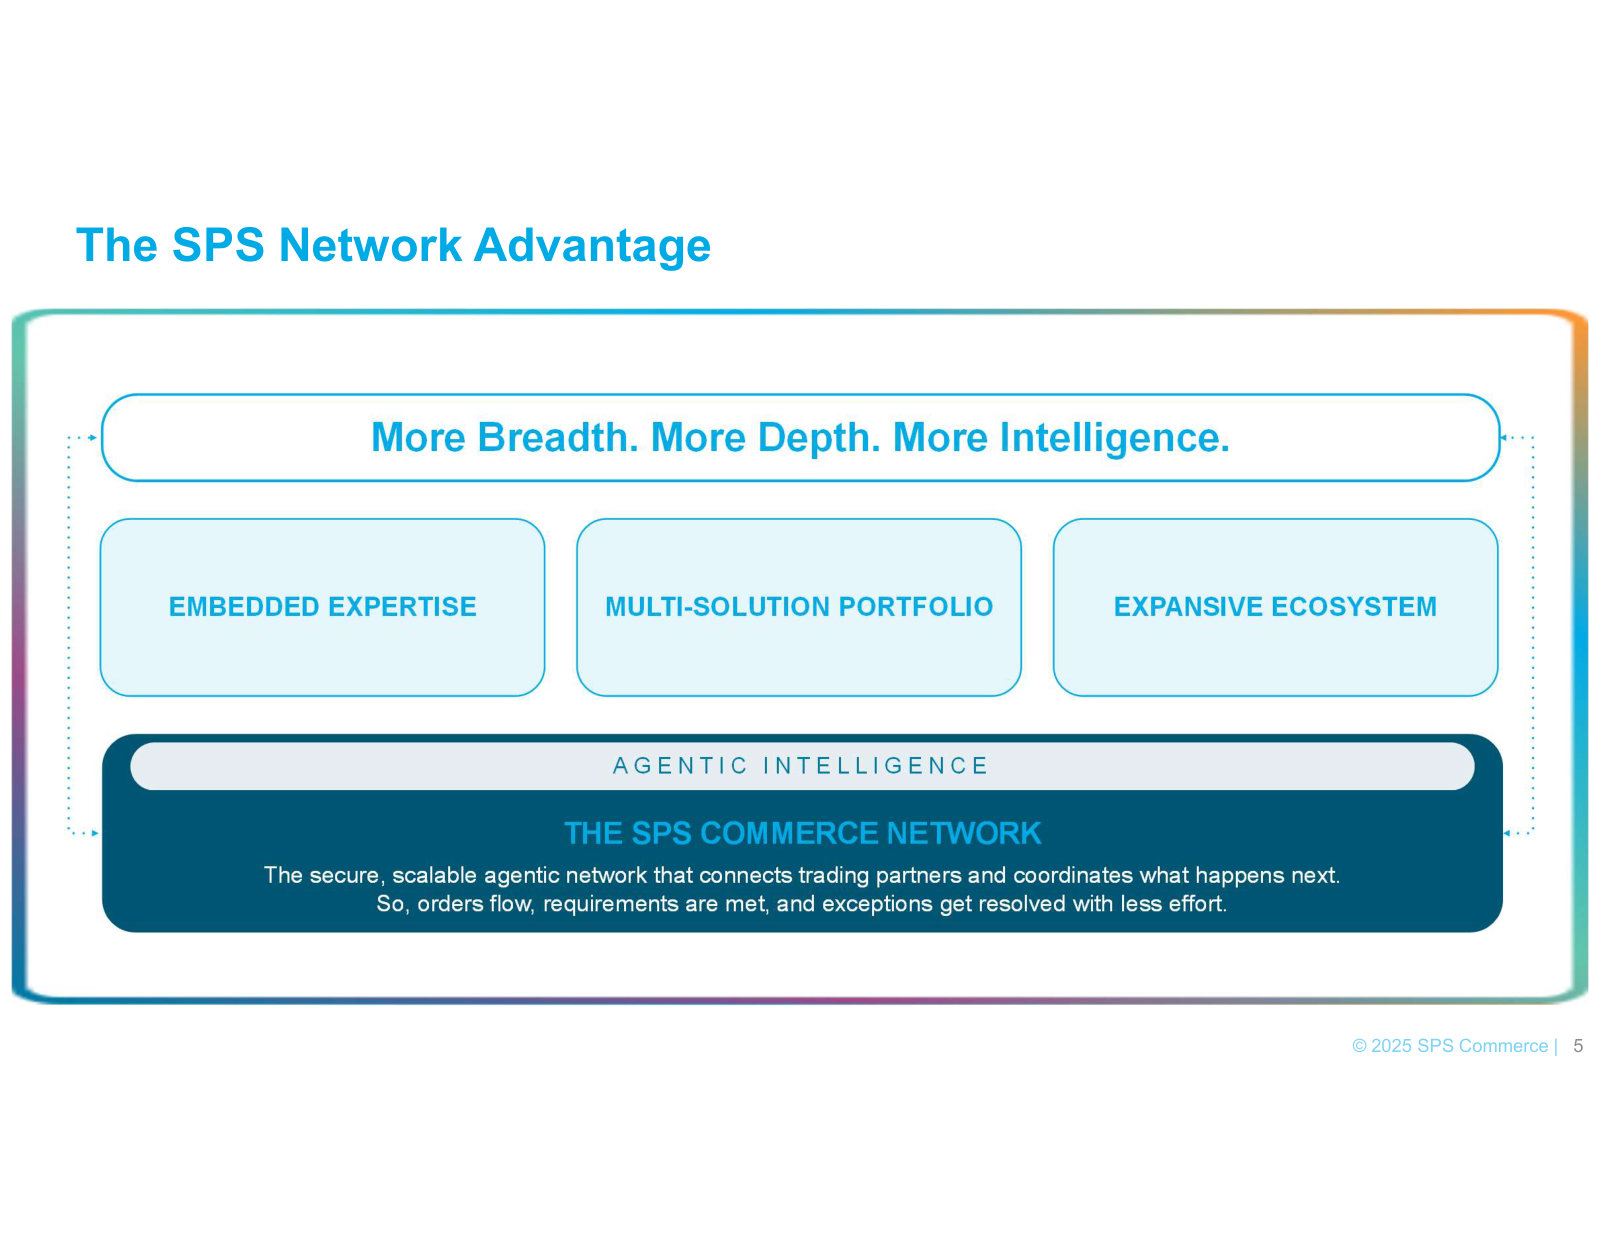
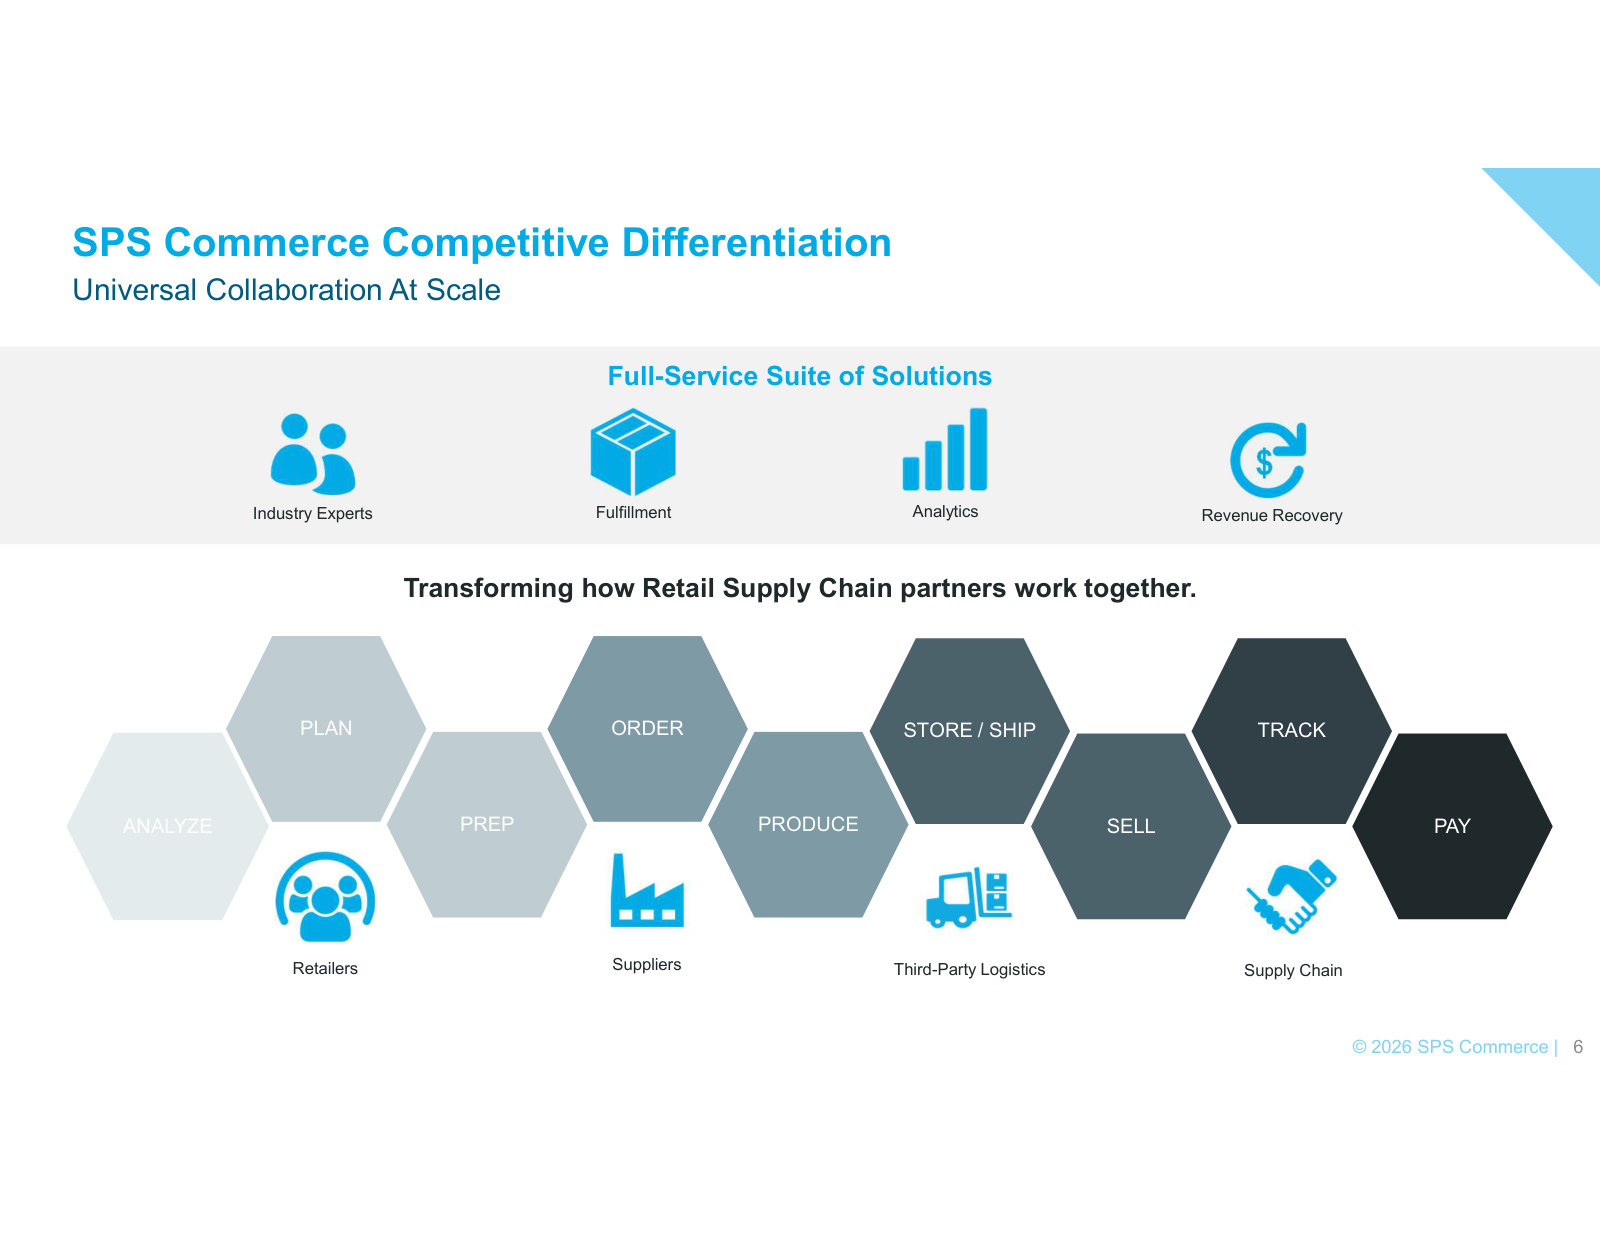
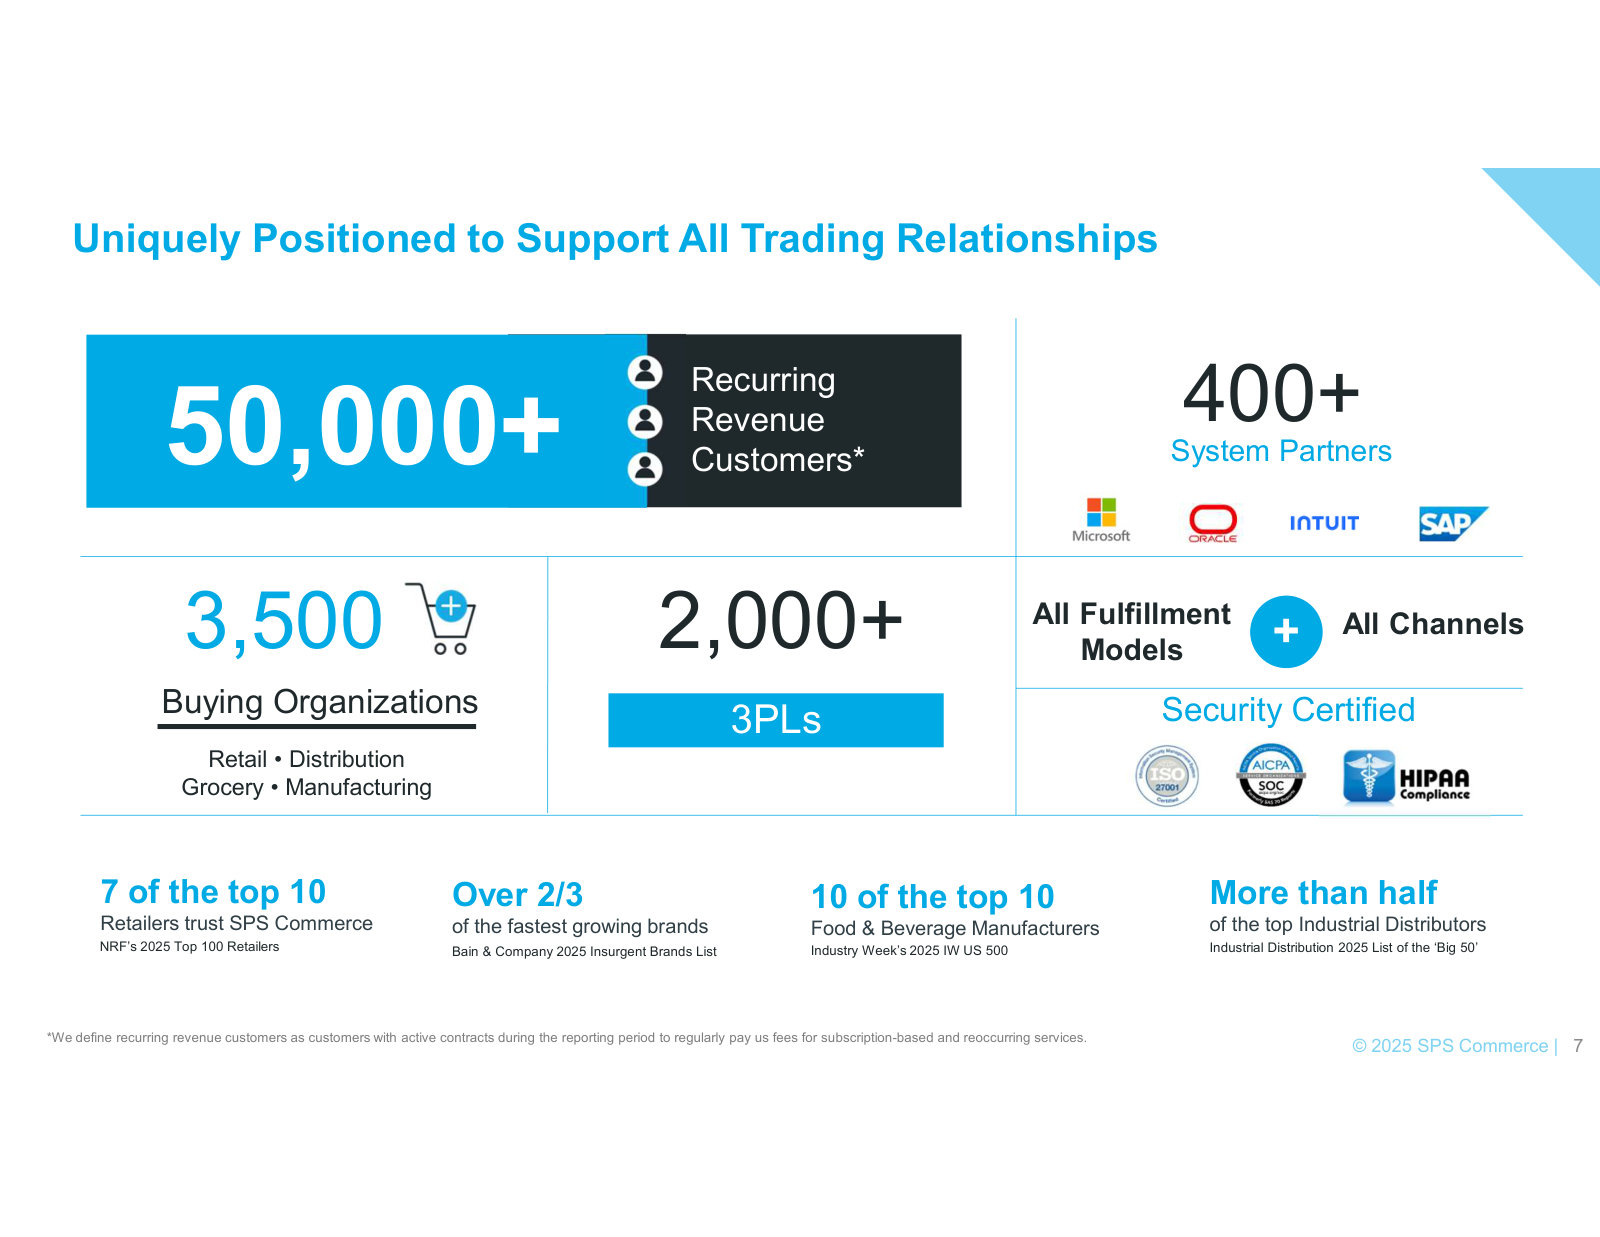
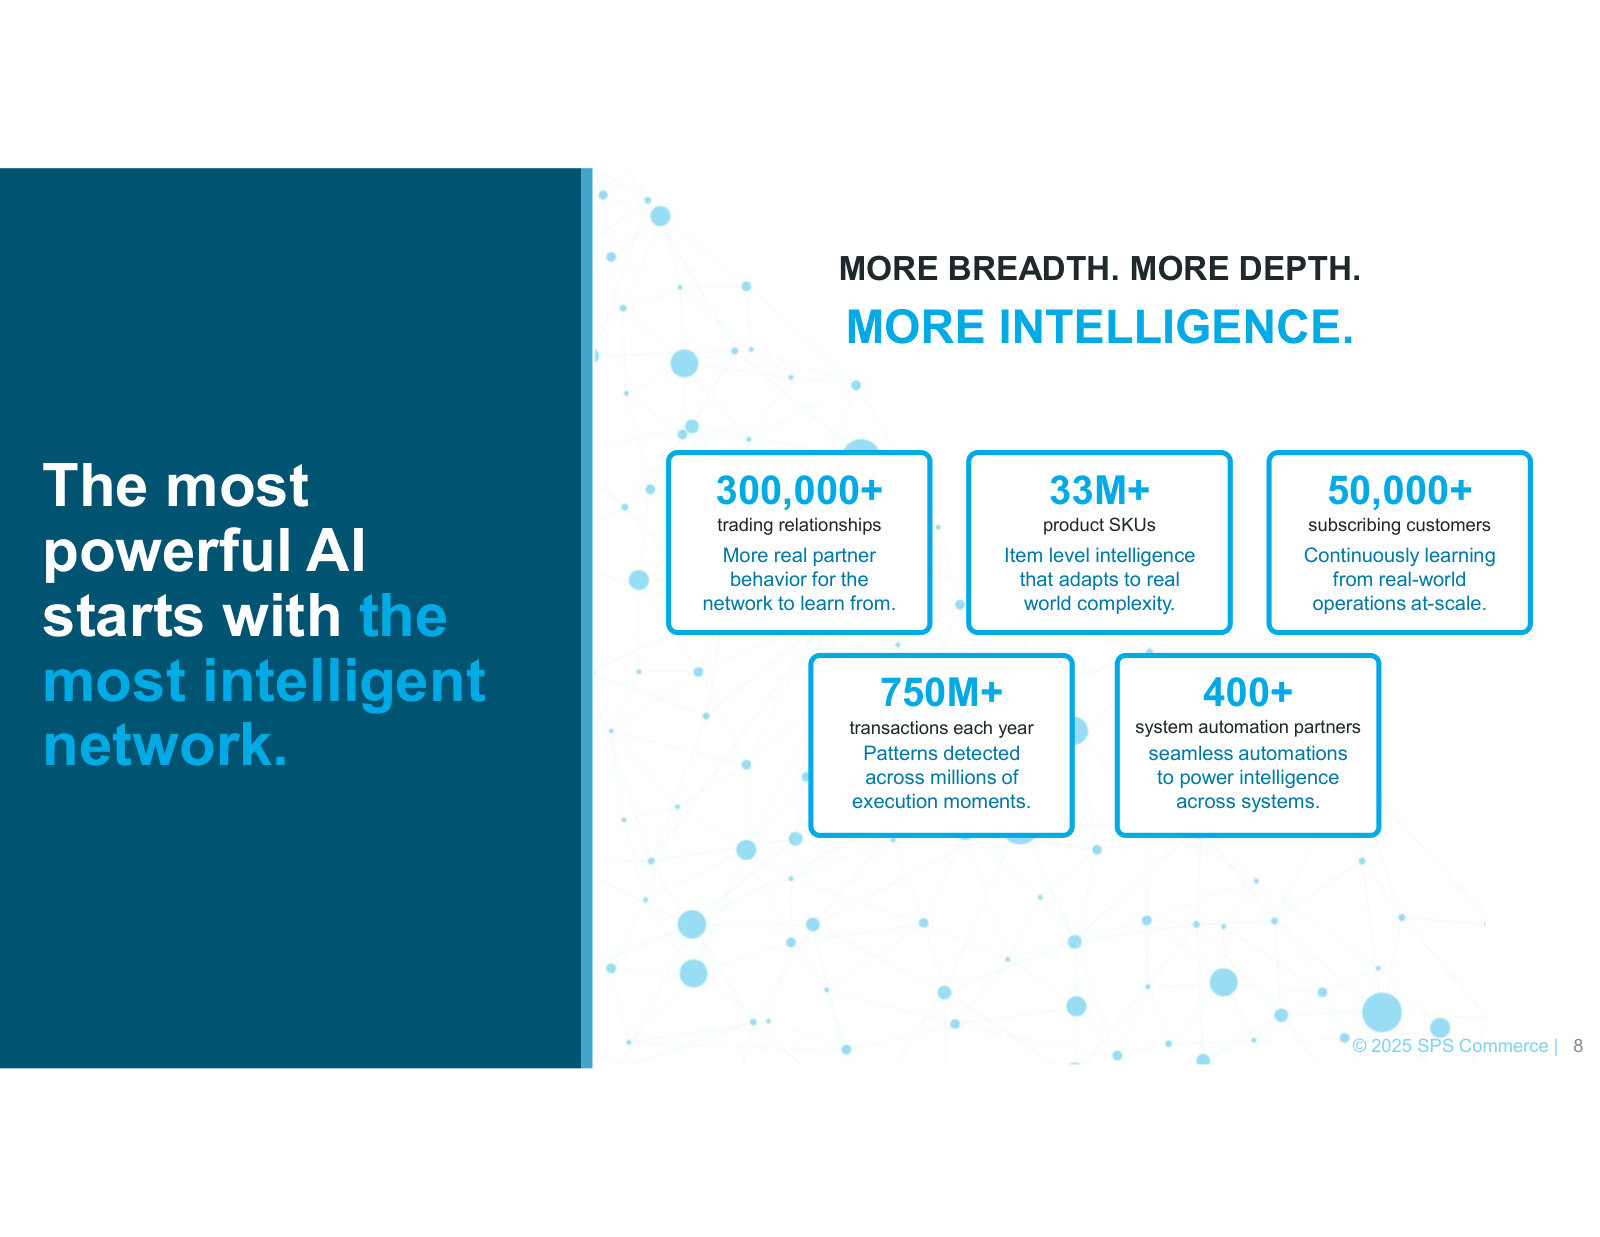
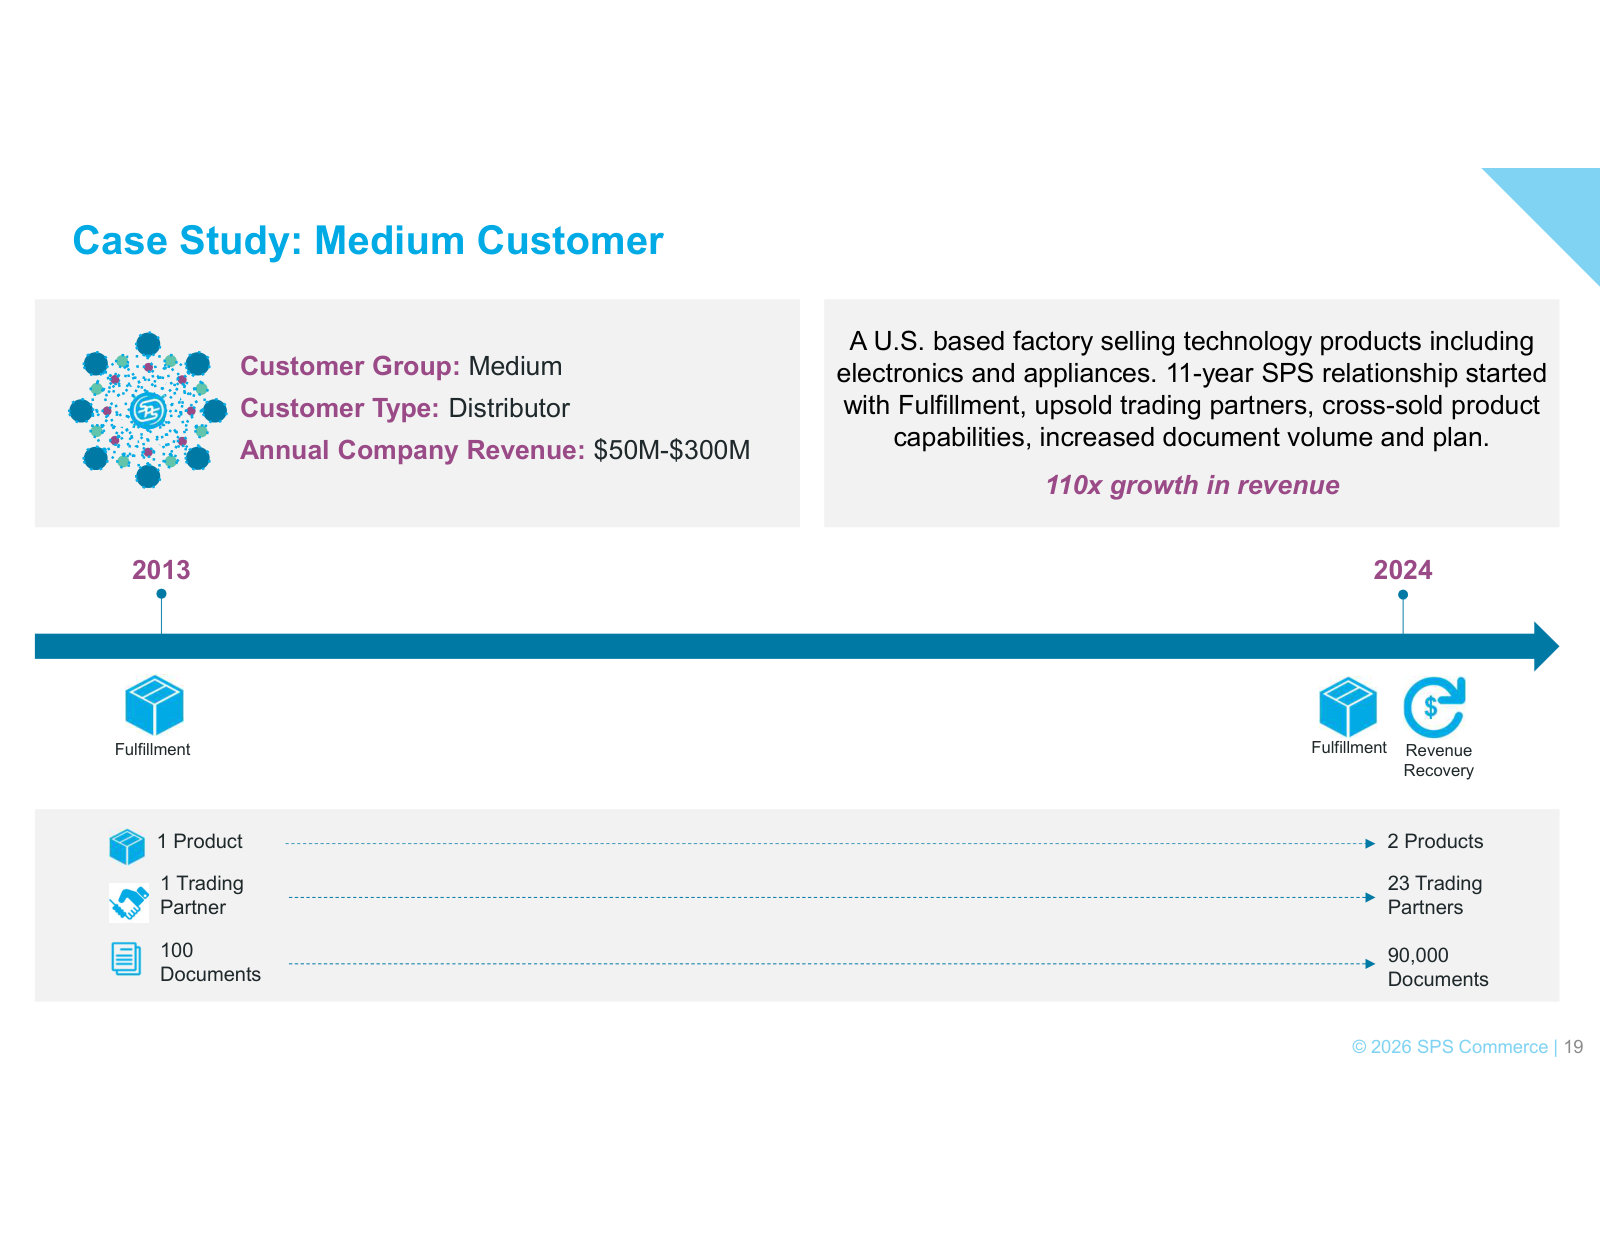
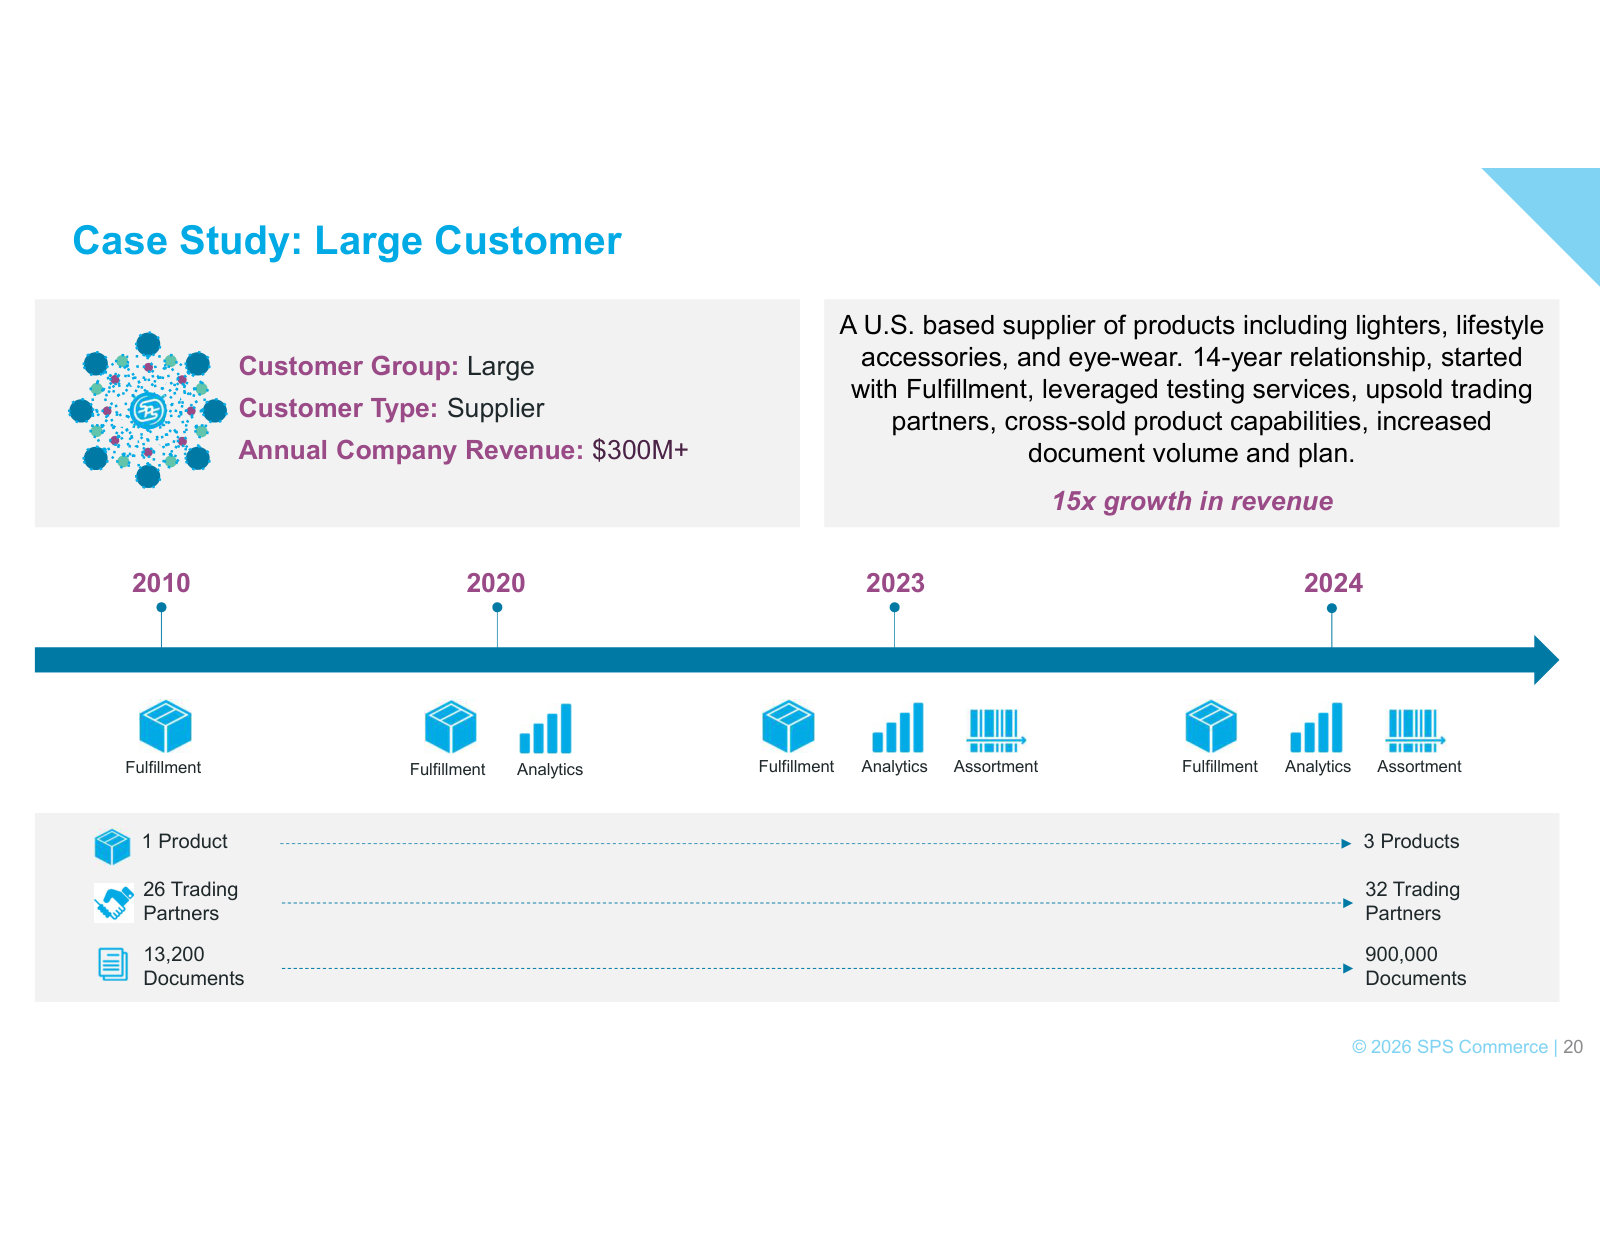
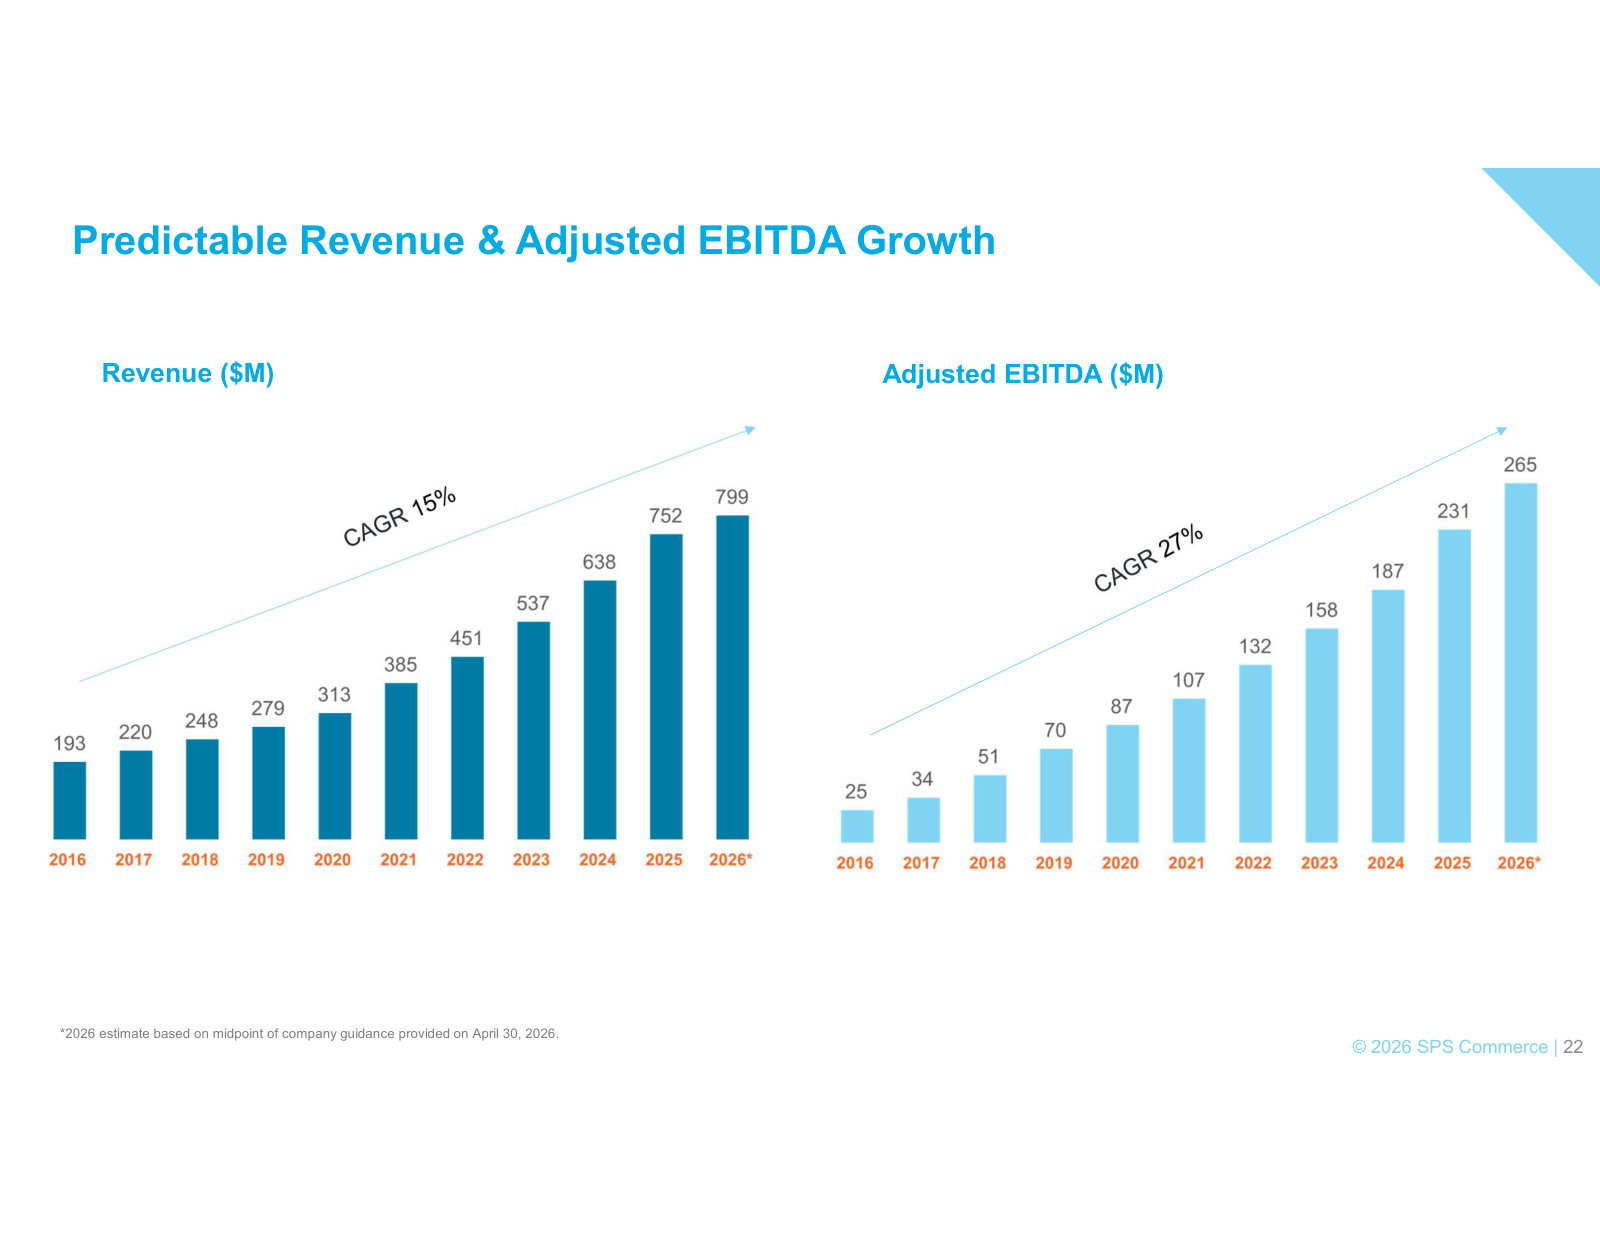
SPS Commerce, Inc.'s management explains the business in its own materials. The slides below do the most of that work, pulled from the documents preserved in Sources. Each source link opens the complete presentation at that slide in a new tab.
Investor Day 2025 — September 2025
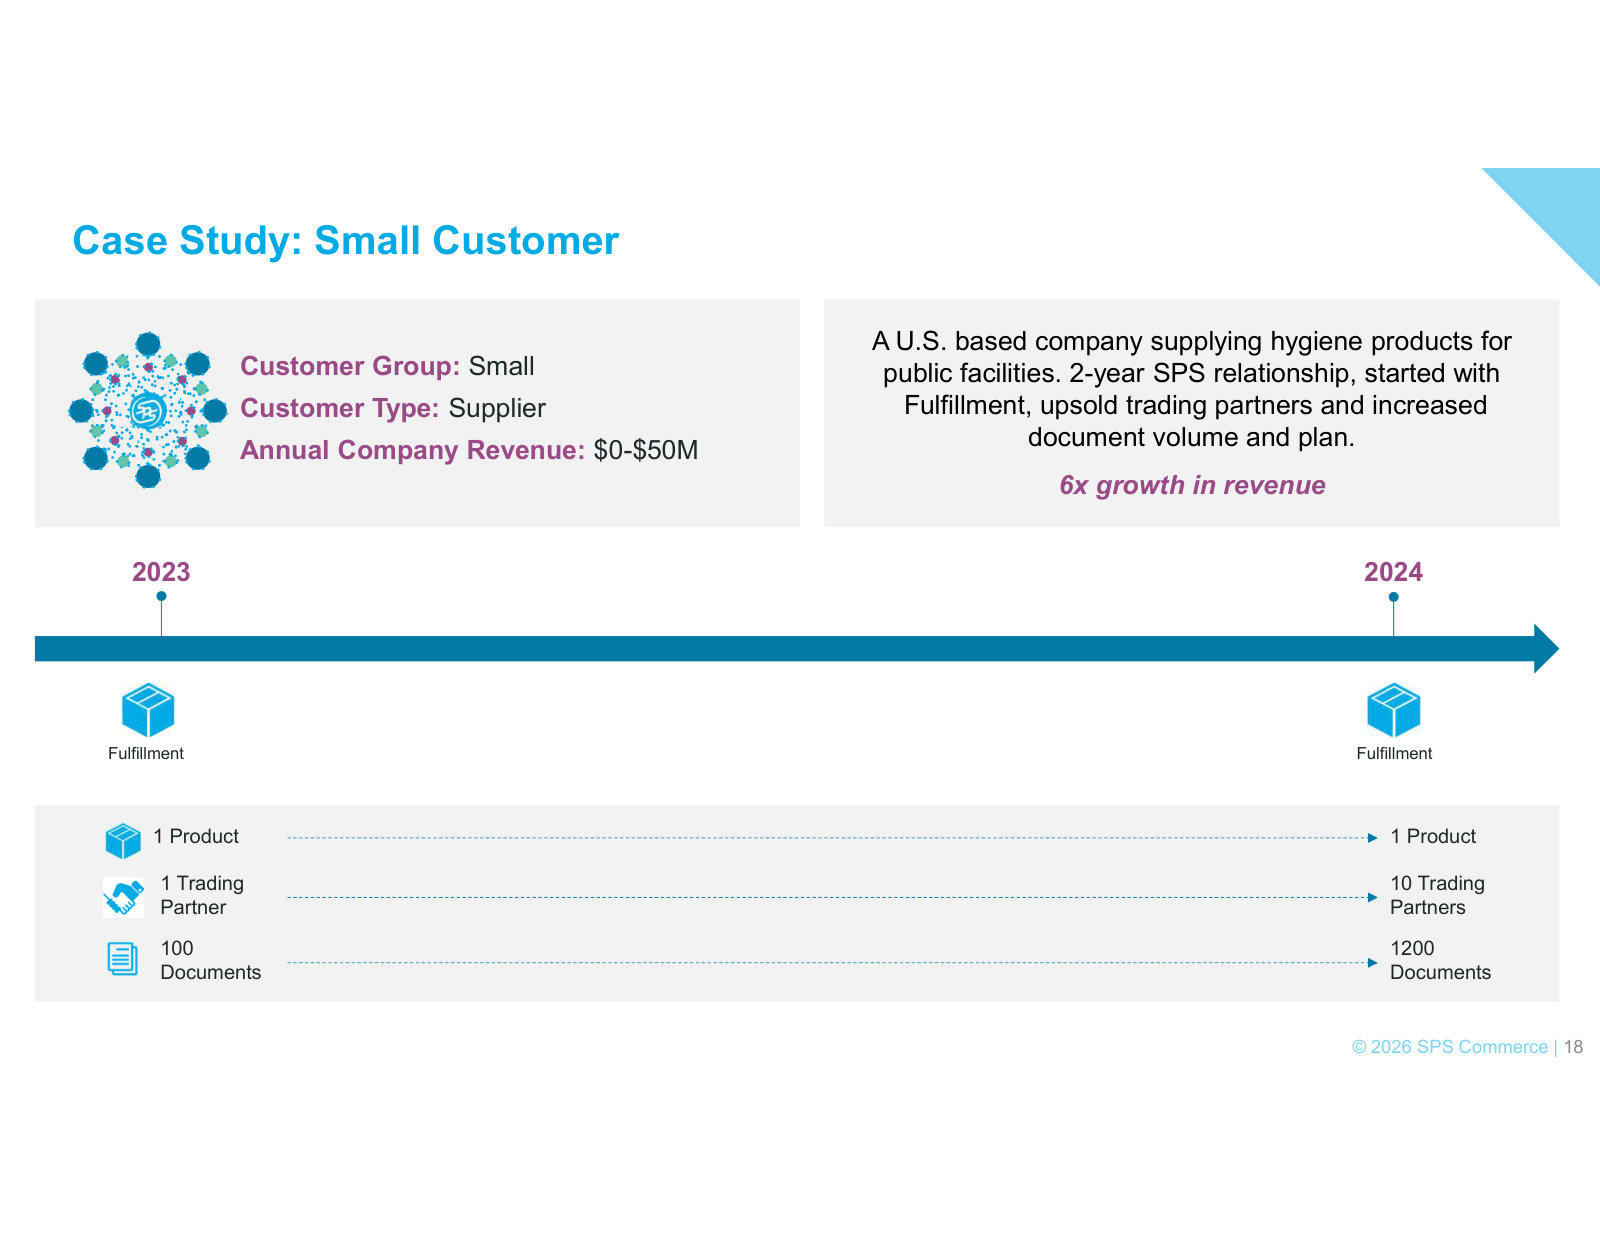
Management's fullest current explanation of the business — strategy, products, the network, go-to-market and the financial model. · Open the full document →
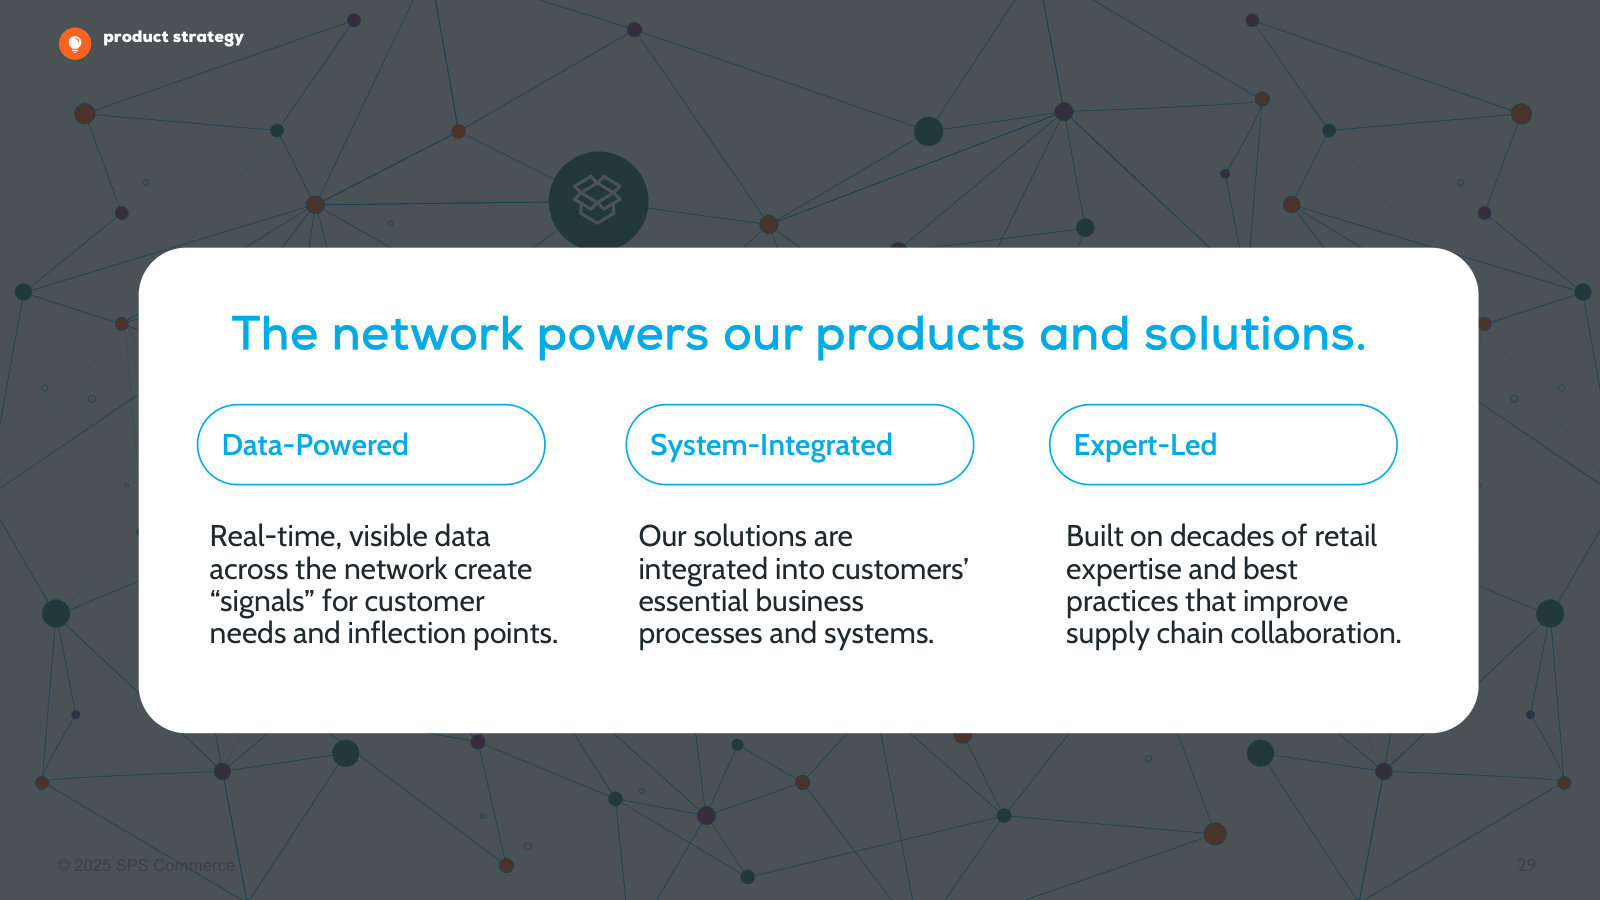
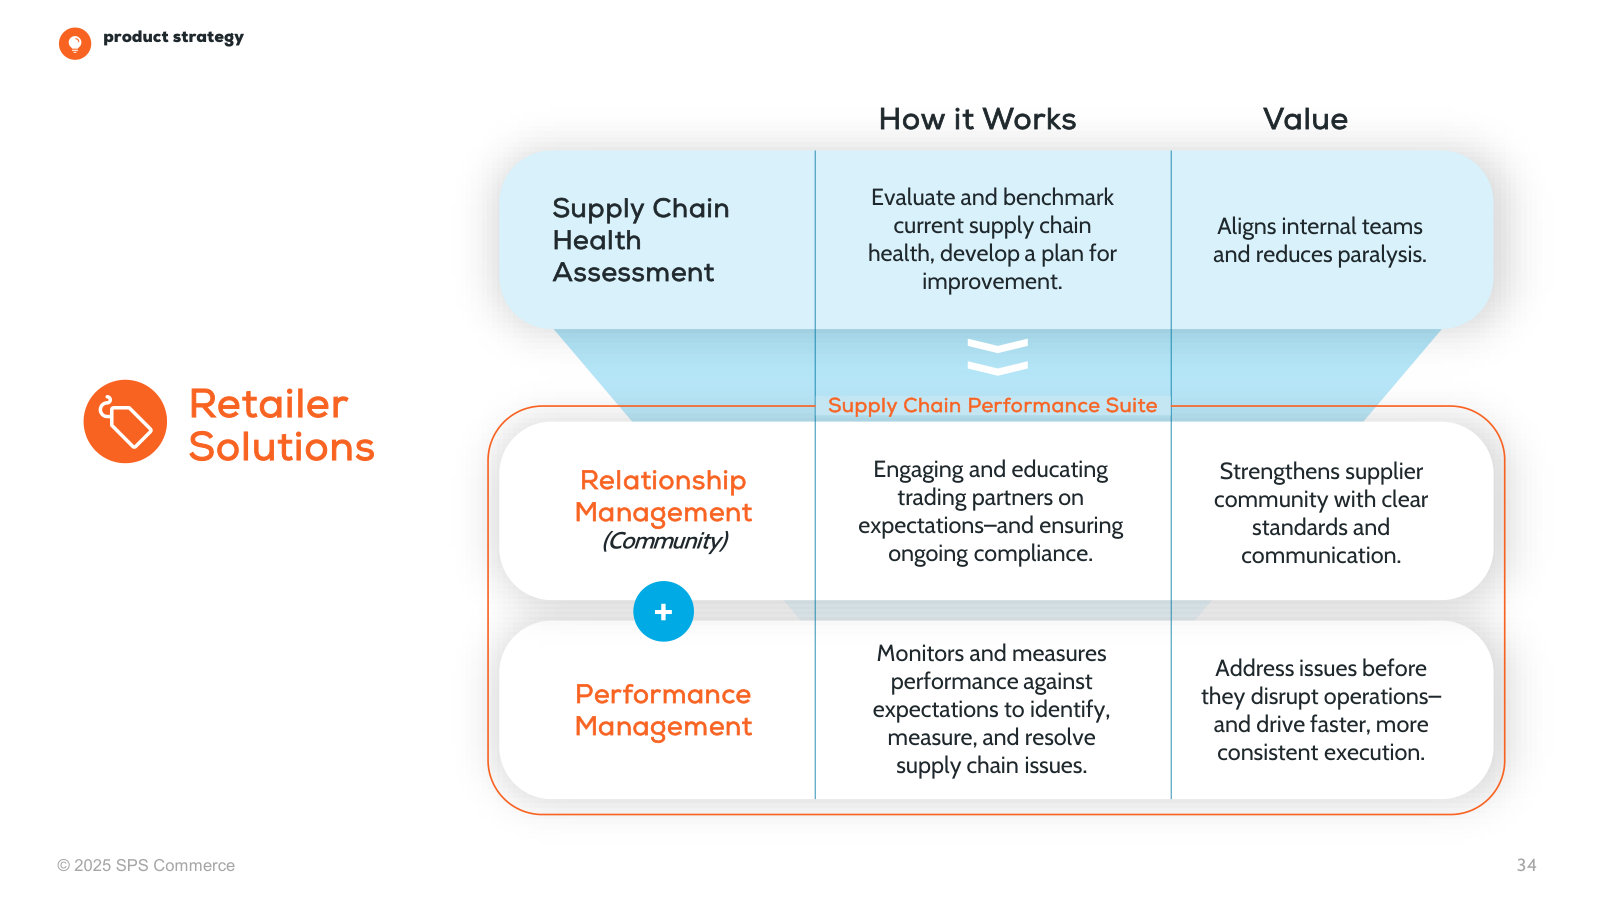
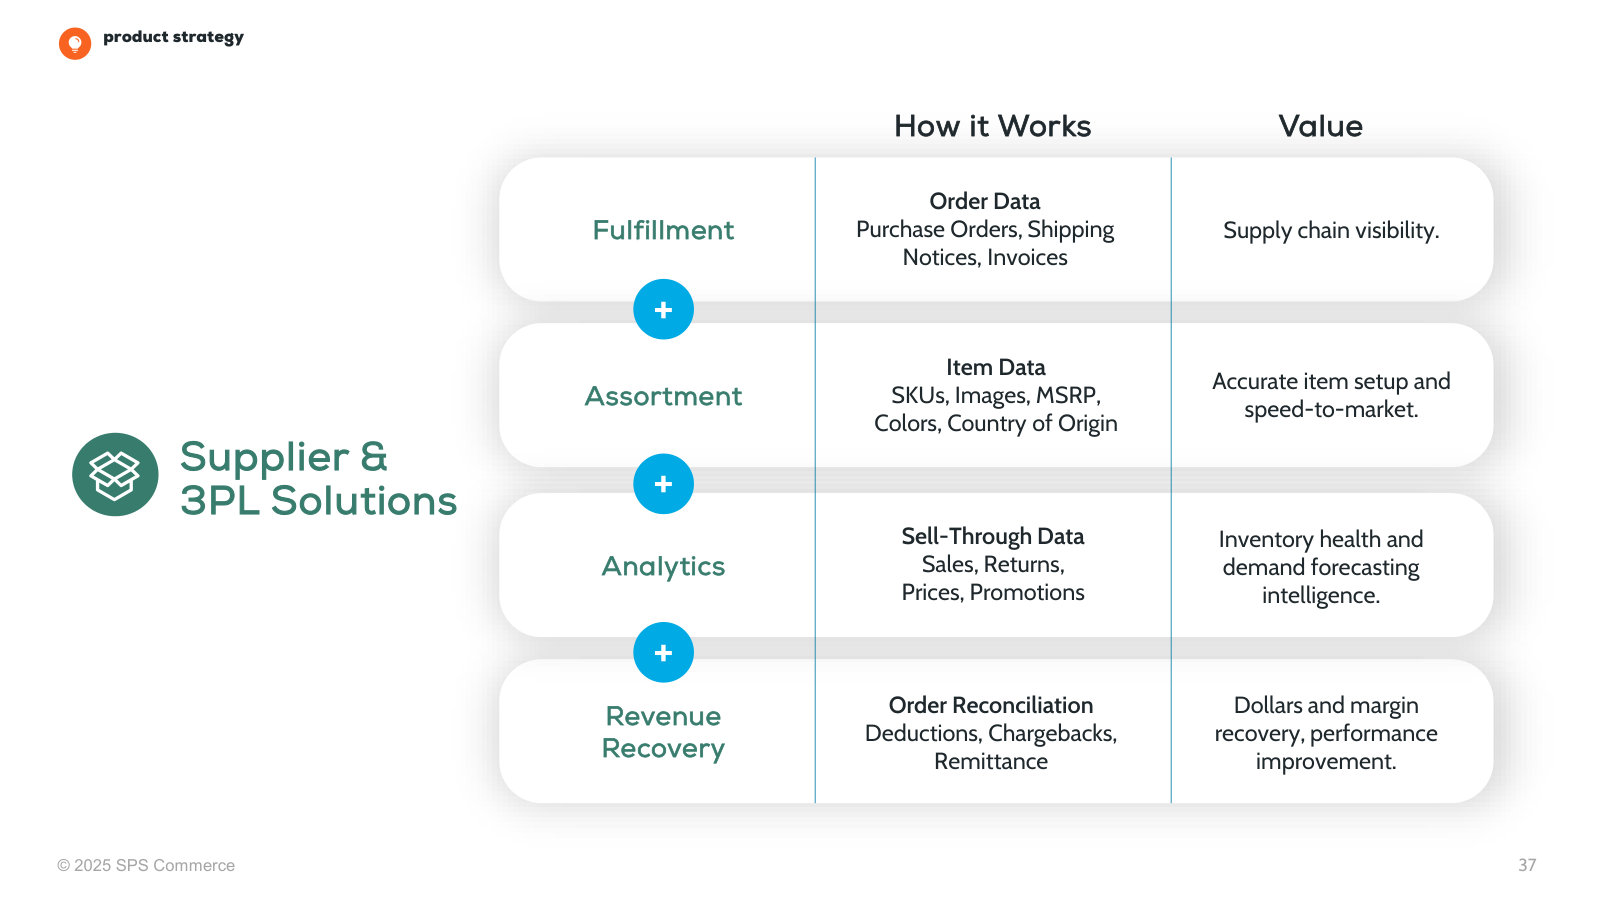
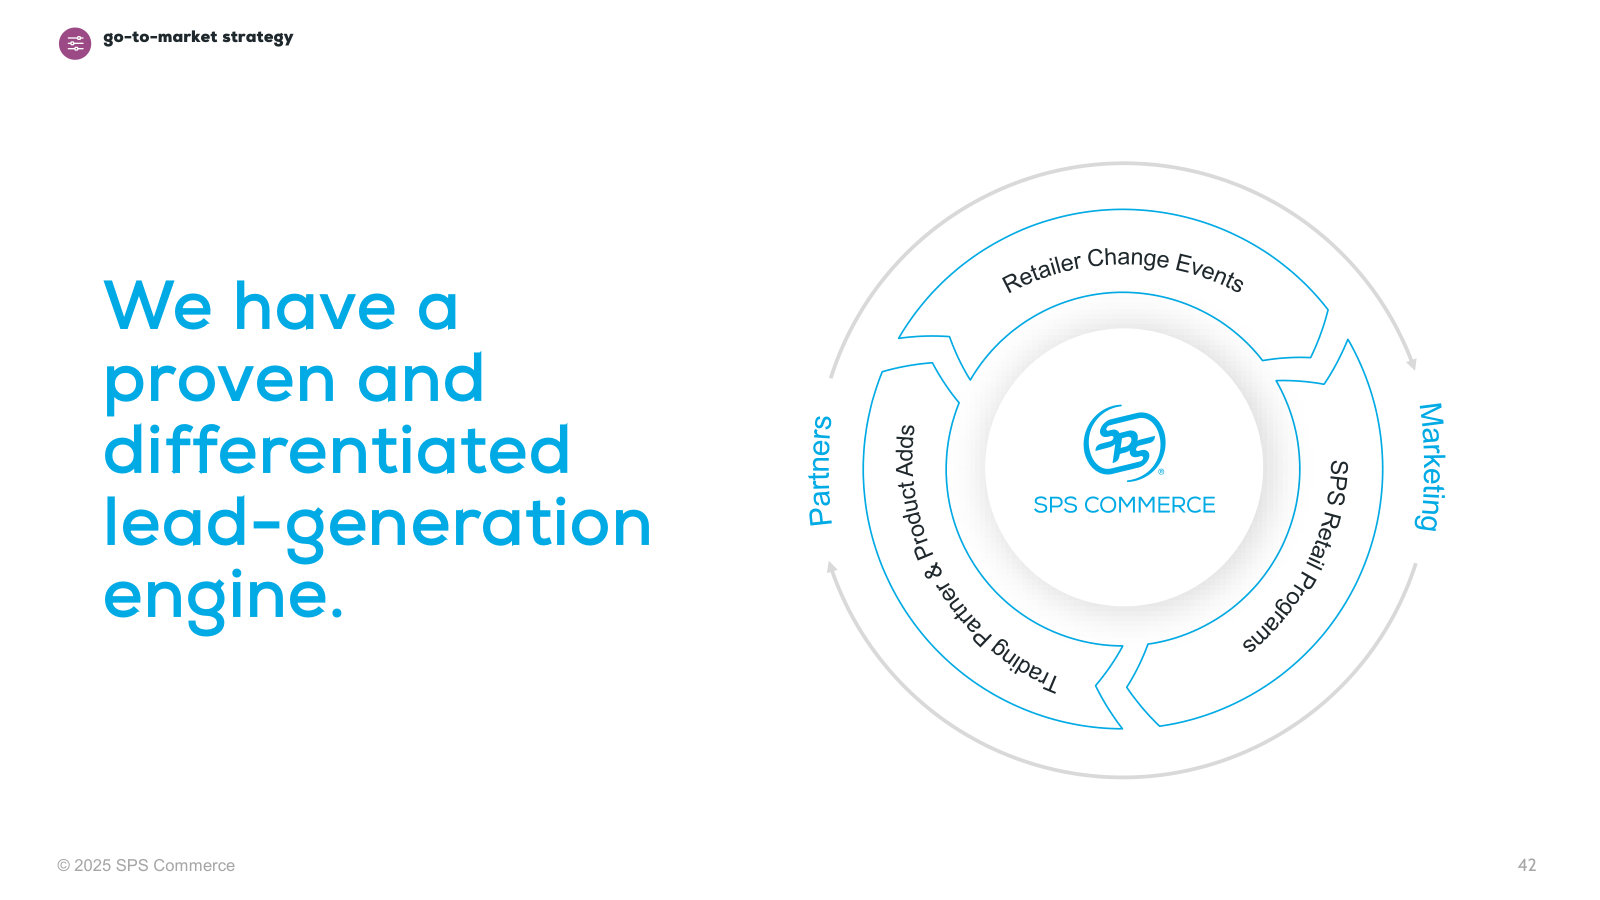
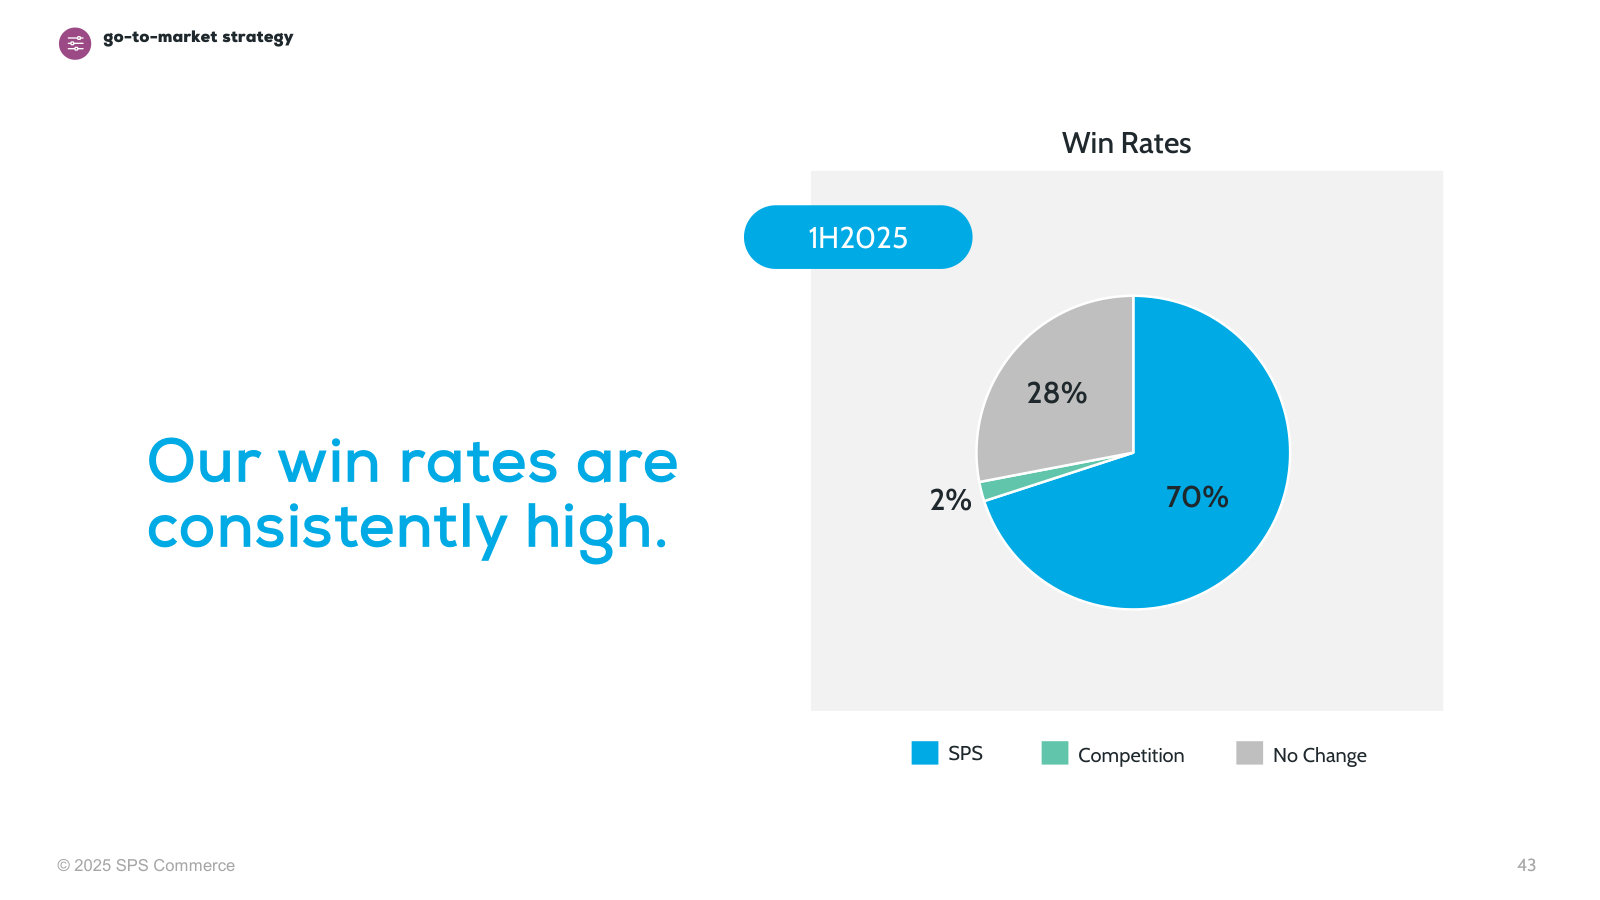
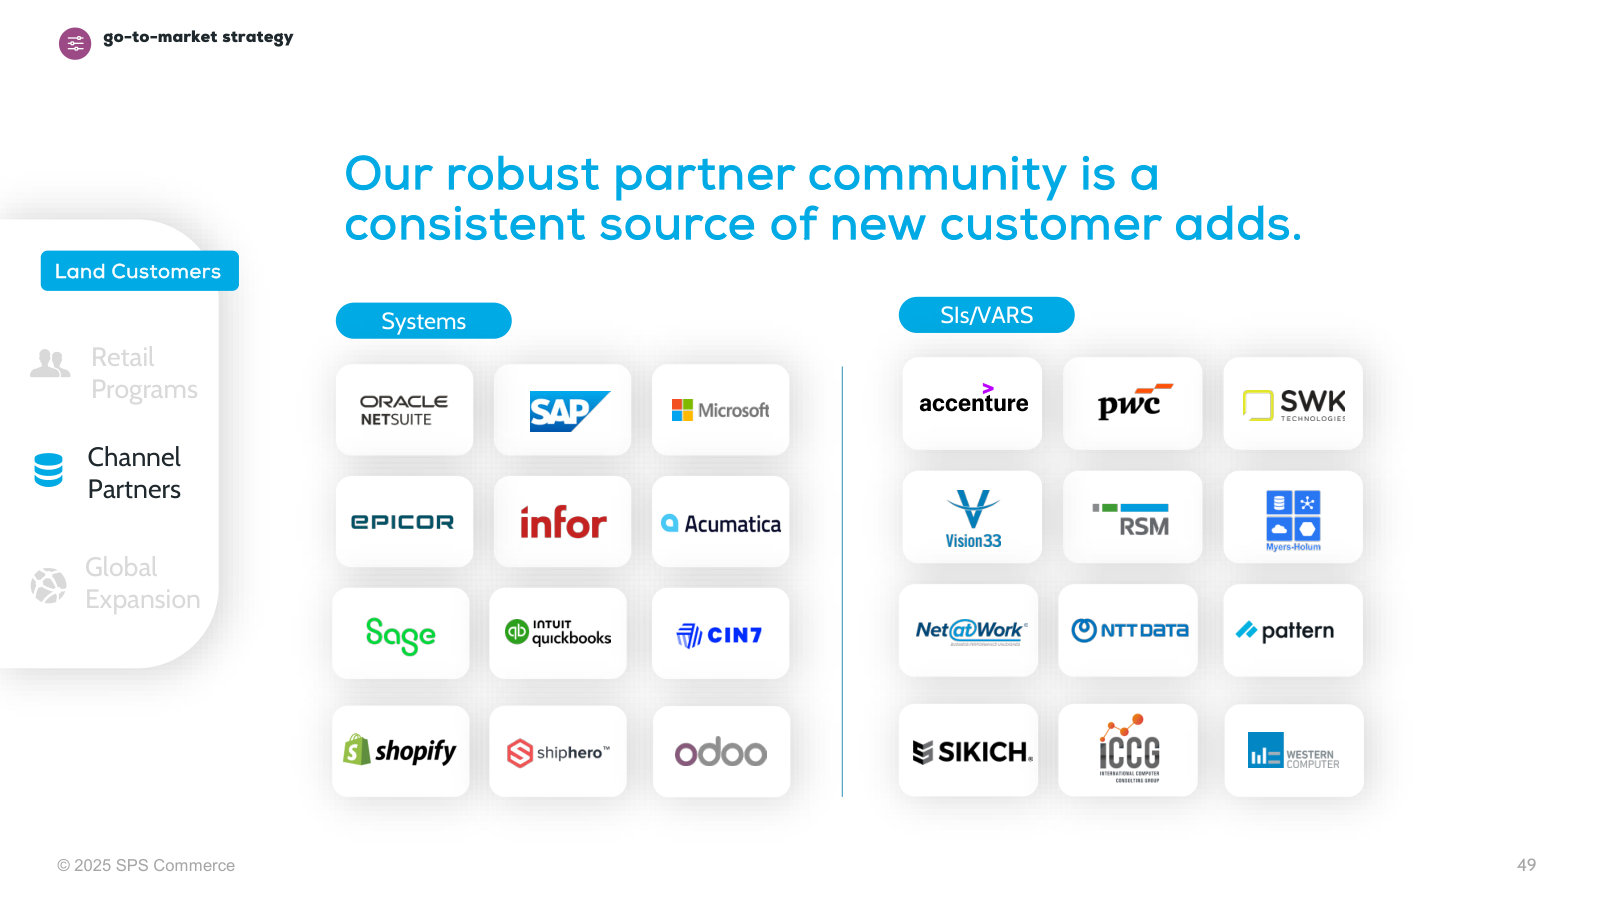
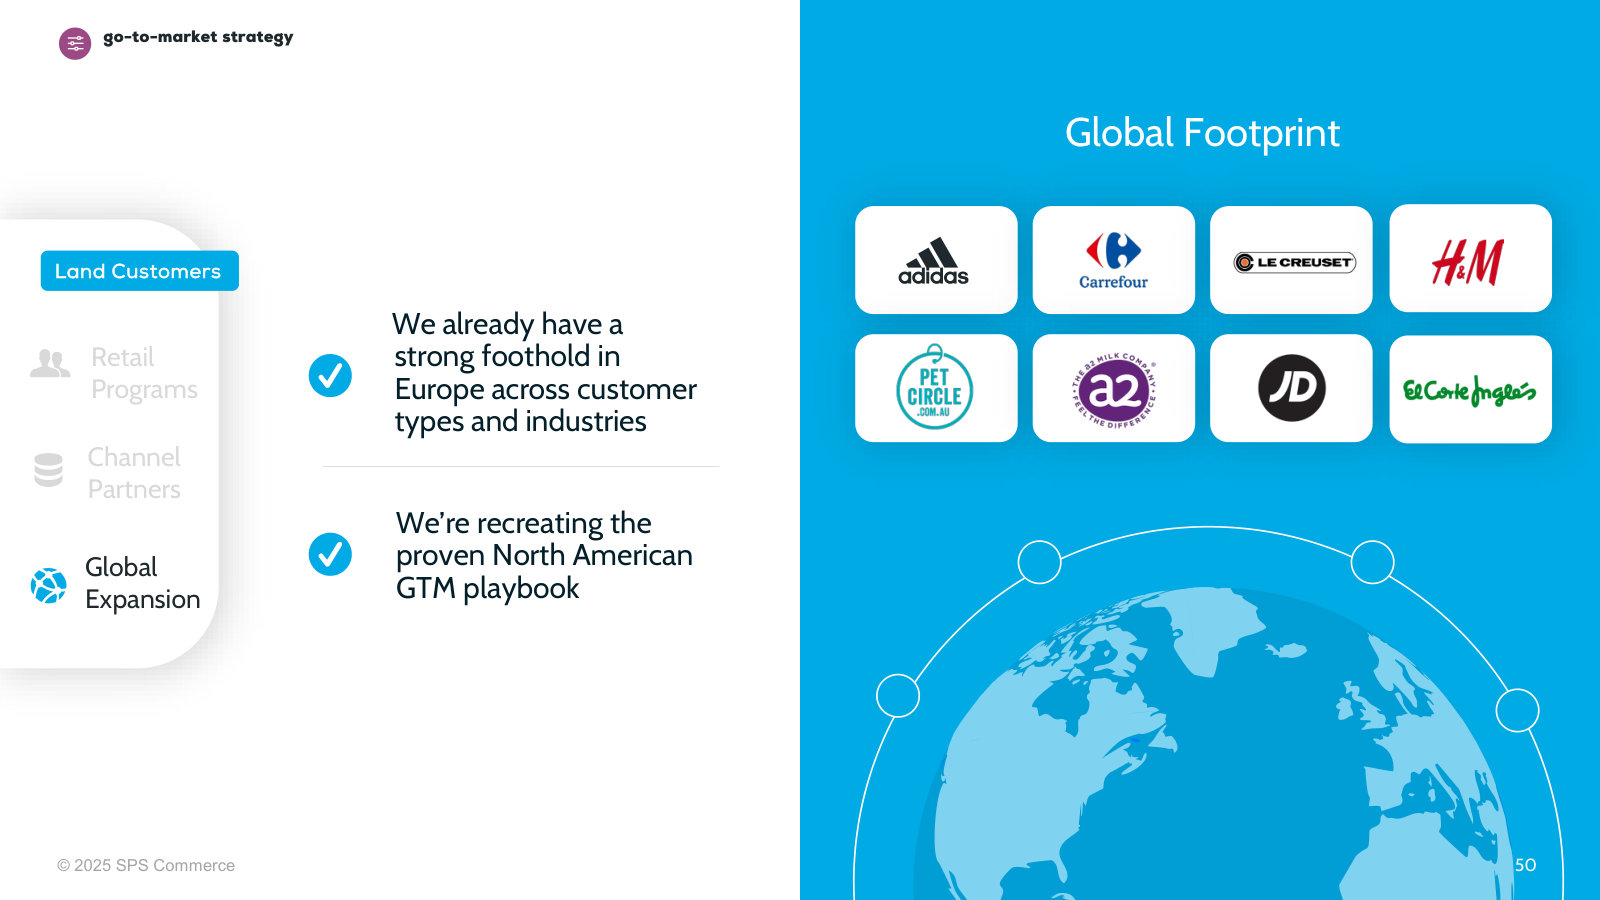
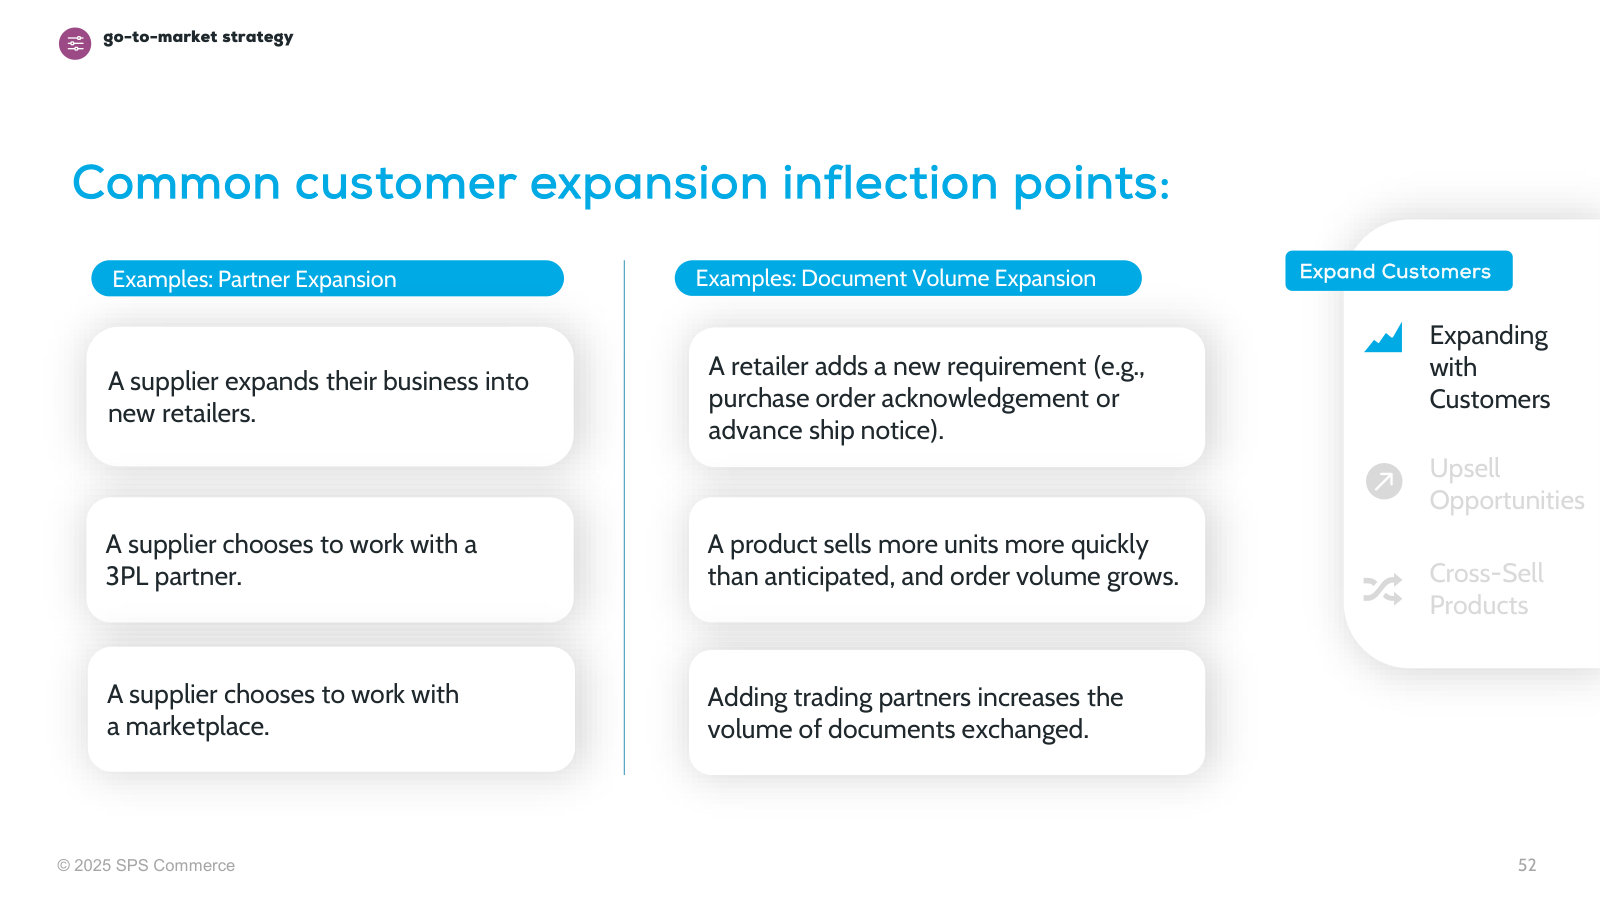
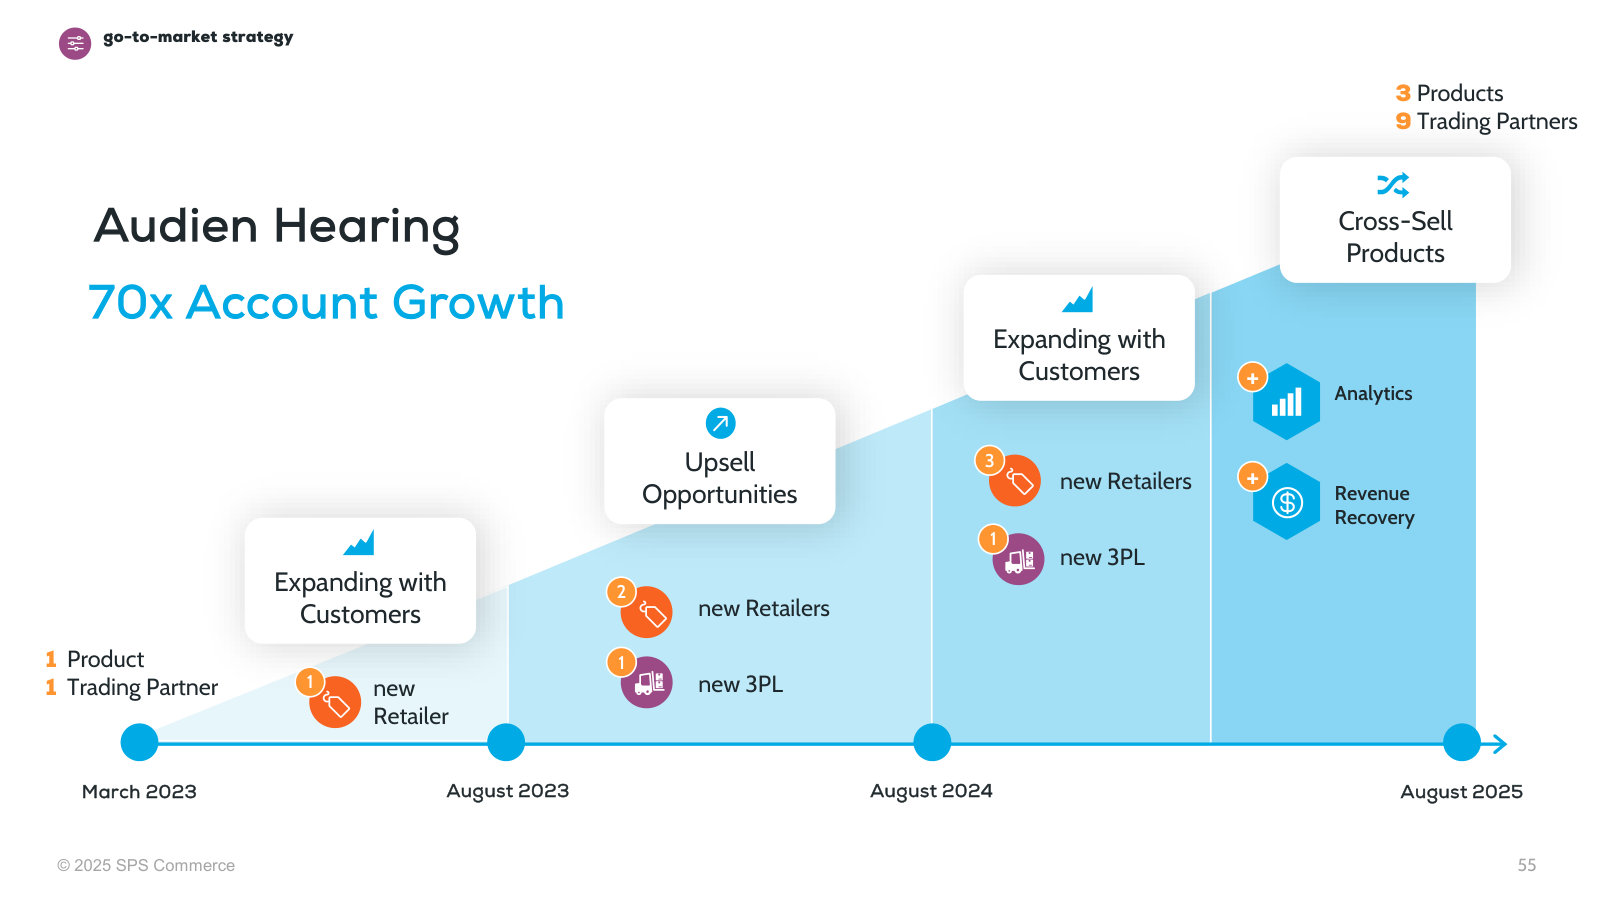
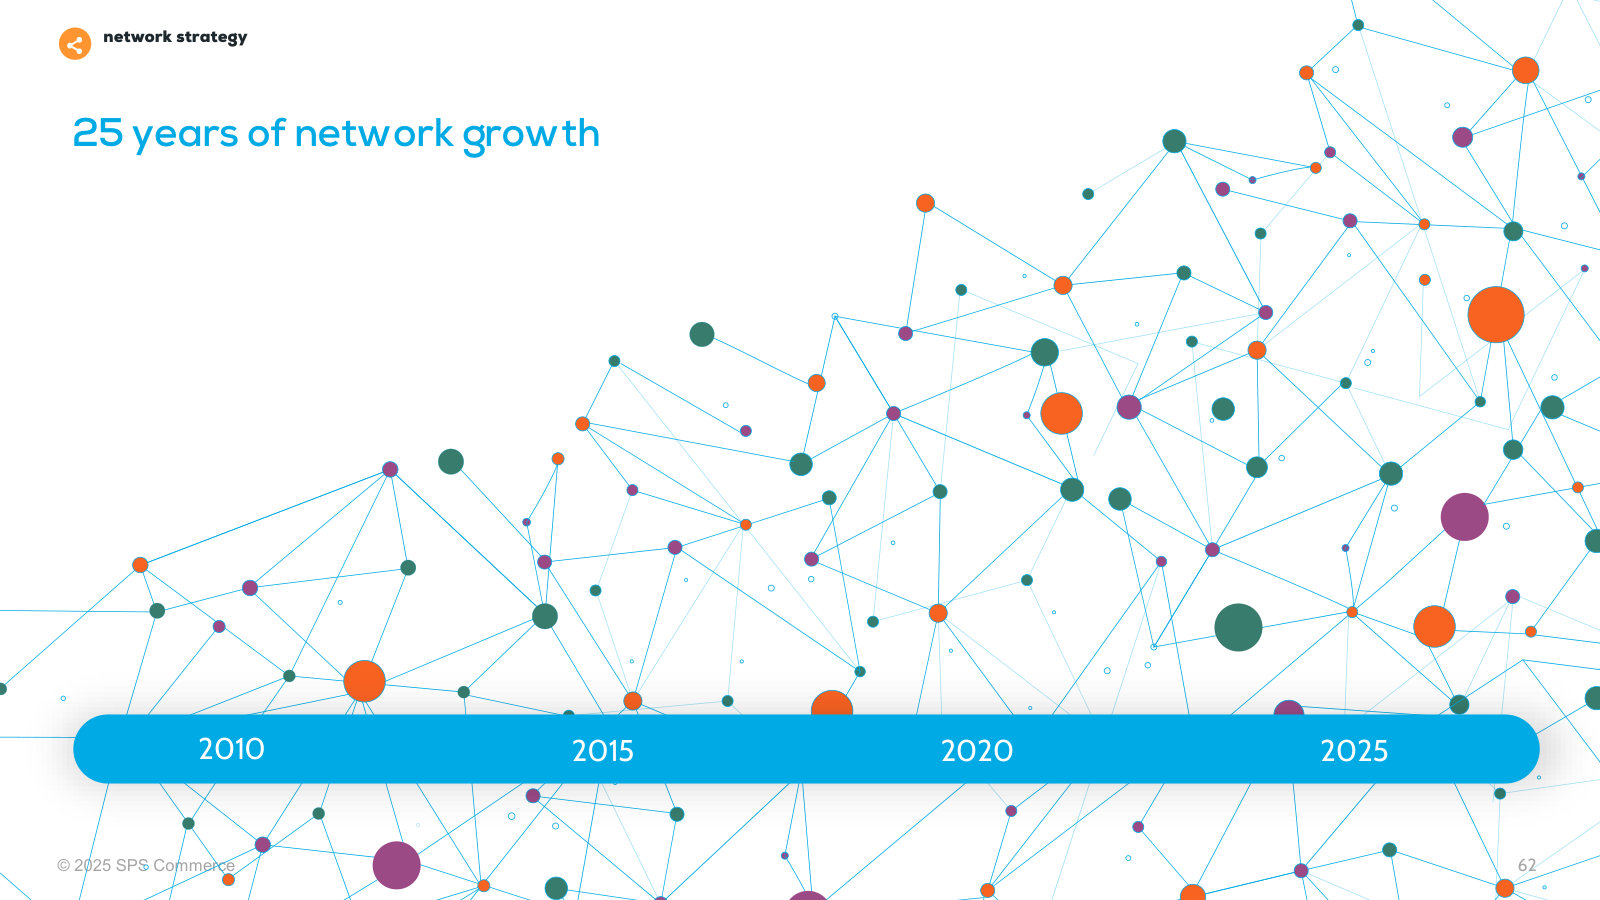
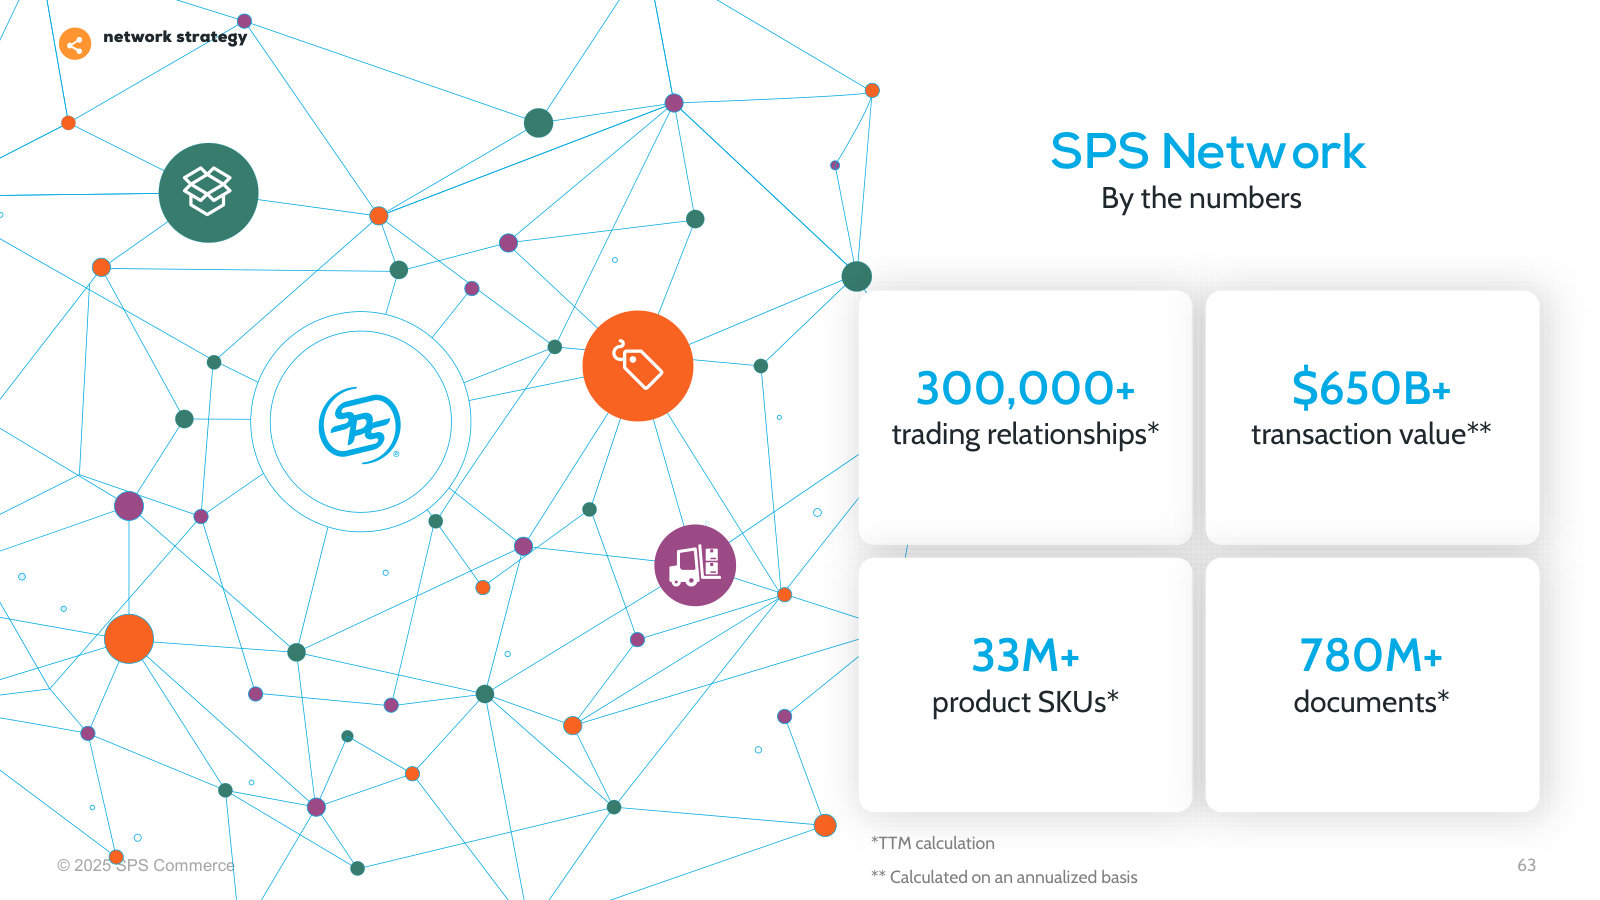
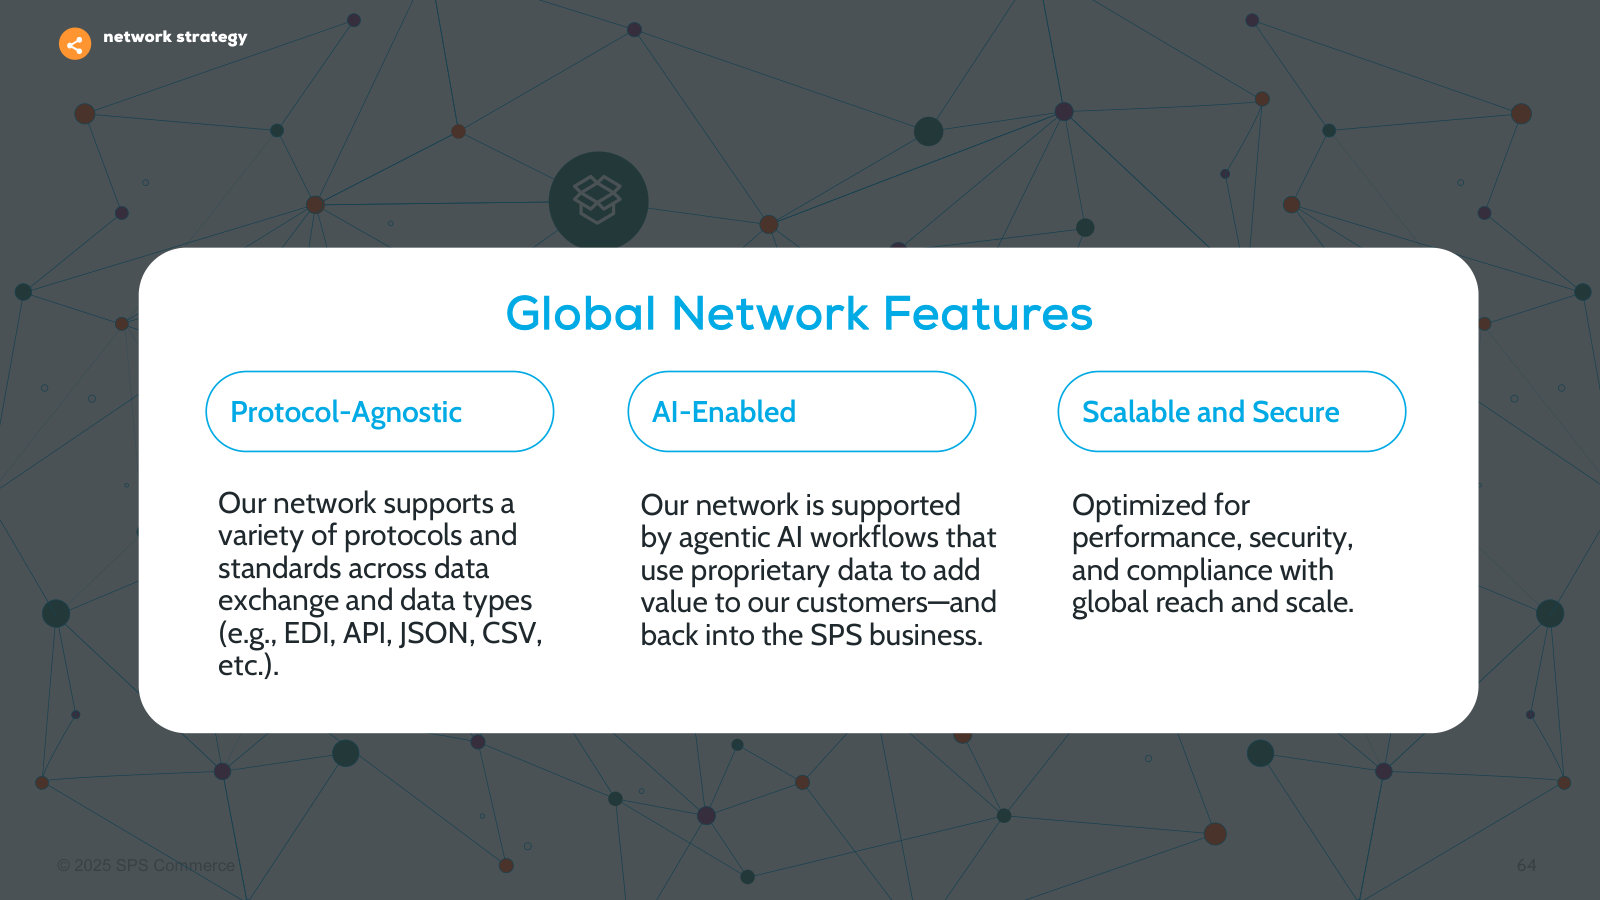
Investor Presentation — Q1 FY2026 — April 2026
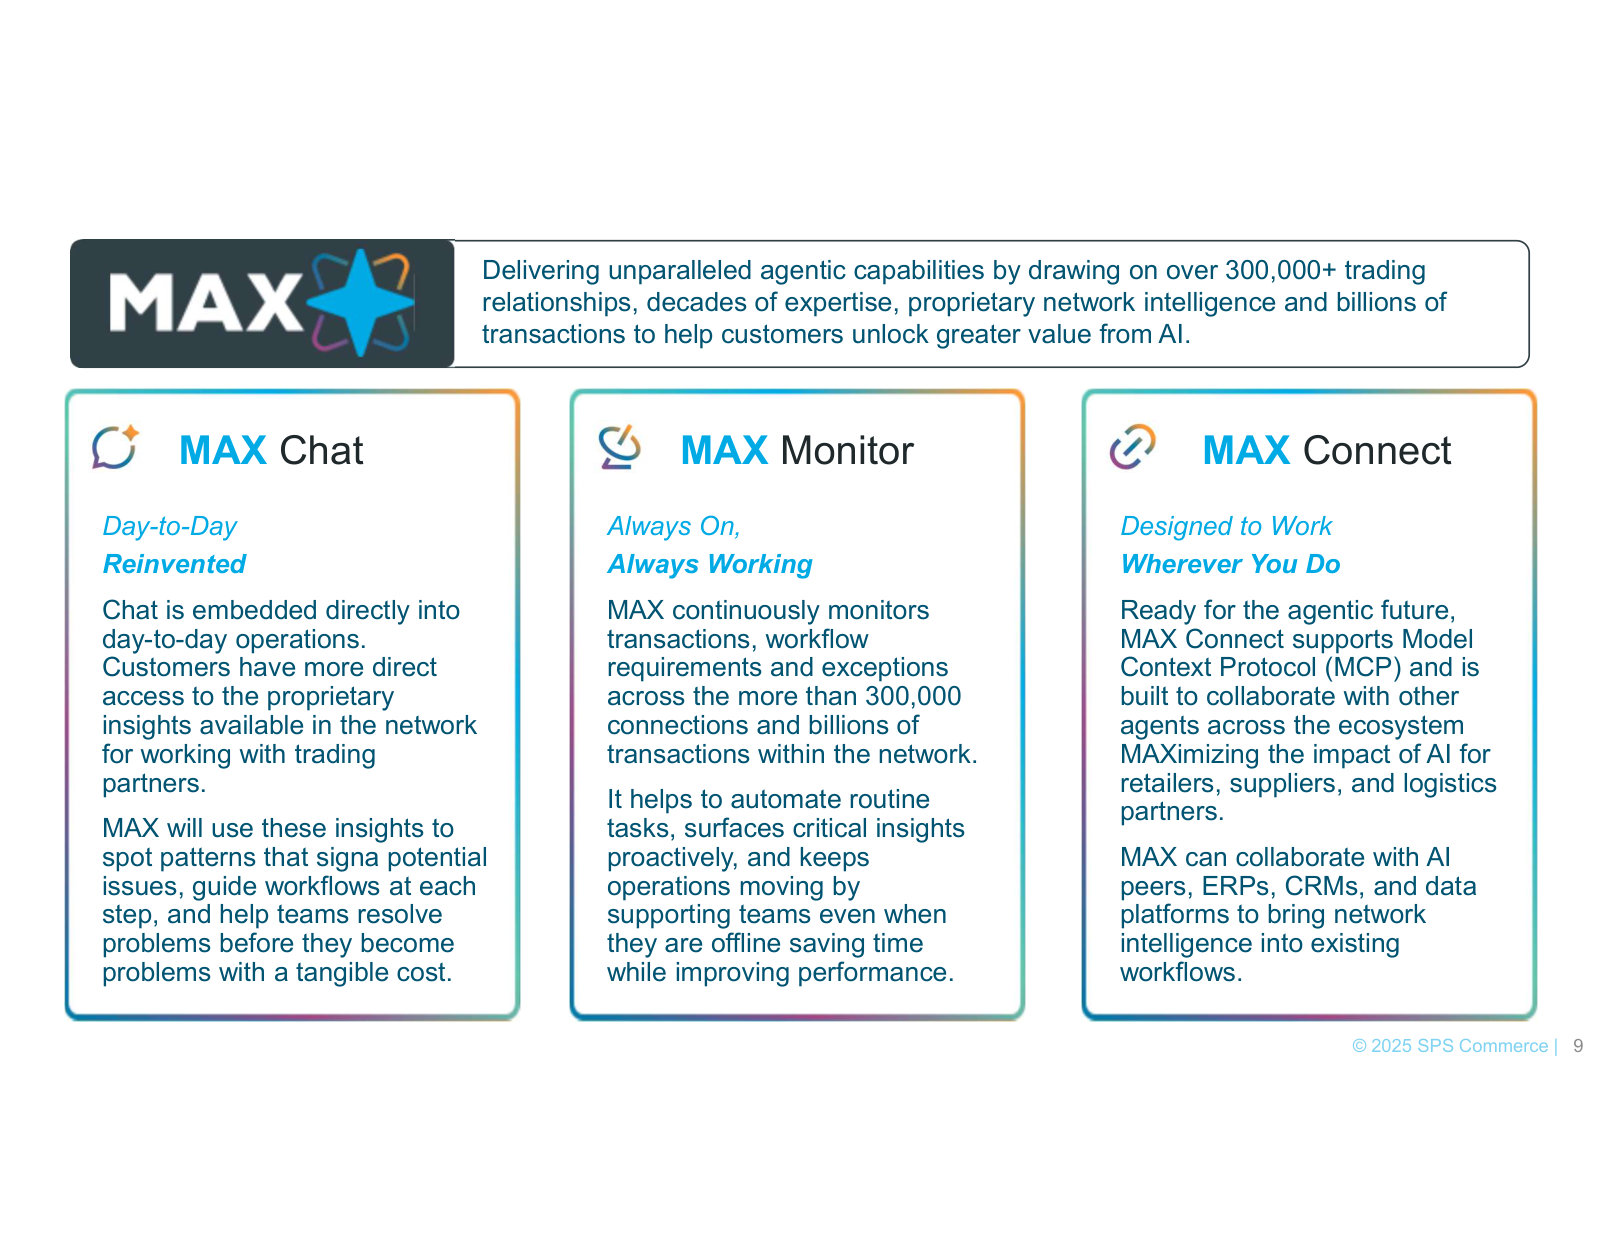
The compact, current company overview — the investment case, the new MAX AI line, and the latest financials and proof points. · Open the full document →
SPS Commerce, Inc.'s management answers for the business every quarter. These are the exchanges that explain it best — verbatim, from the call transcripts preserved in Sources. Each link opens the full transcript at that page in a new tab.
Q2 FY2026 Earnings Call — Q2 FY2026
The current playbook in management's words: the divestiture of the 3P Amazon-seller business, a refocus on 1P suppliers, and the push to monetize the Max AI agent on top of the network. · Open the full transcript →
Zero-to-understanding: what the SPS network actually is.
Chad Collins (CEO): Today, our network stands as a massive, interconnected retail ecosystem of tens of thousands of suppliers and 3,500 buying organizations. Including all the major retailers and distributors in North America.
p. 7 · Read in context →
How the Max AI agent sits on the network — the layer SPS now intends to monetize.
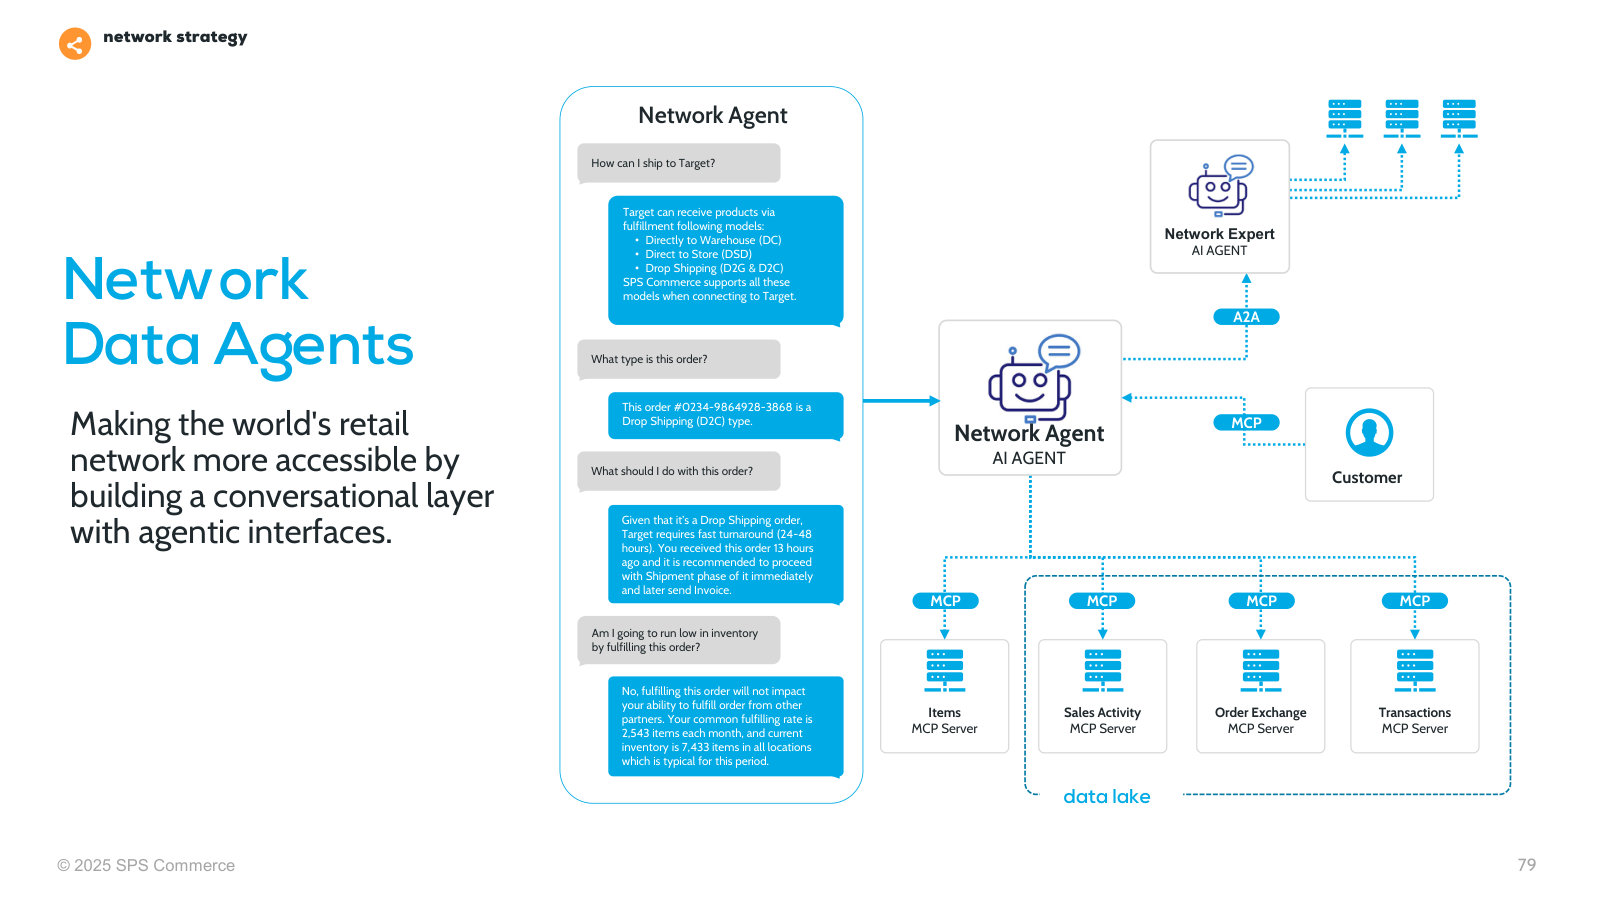
Chad Collins (CEO): By leveraging SPS's network intelligence, within everyday workflows, Max enables customers to interact with their supply chains in a more intuitive, proactive, and connected way. Users can instantly compare business requirements and business performance between major retailers like Target and Costco. With proactive monitoring, Max serves as a 24/7 extension of a customer's team, detecting anomalies and flagging critical business errors. Max puts the expertise of the SPS network at the customer's fingertips, to instantly diagnose business issues and determine actionable solutions.
p. 7 · Read in context →
Management's one-sentence statement of the competitive moat.
Chad Collins (CEO): No other company can match the unique combination of AI capabilities, 25 years of proprietary data, deep domain expertise, and an expansive network access to drive this kind of tangible value and collaboration that SPS offers today.
p. 10 · Read in context →
The hardest question of the quarter — why divest the 3P business — answered: 1P suppliers fit the portfolio, 3P Amazon sellers did not.
Chad Collins (CEO); Scott Berg (Needham): Where more of that positivity was, though, is on the 1P supplier side. So those that are selling primarily wholesale to multiple retailers, Amazon being one of those. But the 1P suppliers really can use our whole portfolio revenue solutions across multiple retailers whereas the 3P business was, those were more Amazon sellers. There did not turn out to be a lot of overlap with the other parts of our portfolio for those customers. […] Think that combined with the take rate revenue model and some of the policy changes in 3P we saw from Amazon all clearly pointed out that the 1P side of this business is much more attractive for us and has much more overlap with our ideal customer profile than the 3P side does.
p. 13 · Read in context →
Why the network is the growth engine: it tells SPS which customers to cross-sell, and how much they can recover.
Chad Collins (CEO): So the network actually tells us based on trading volumes and trading partner relationships who are the most likely candidates. In fulfillment for revenue recovery. And using that data, we are able to specifically go and target those customers, in some cases, to them with an estimate even just based on our network data on what the potential is for them to recover.
p. 21 · Read in context →
Q1 FY2025 Earnings Call — Q1 FY2025
The Carbon6 acquisition and the tariff shock in one call — the clearest test of why demand holds up in a rough macro and how much of SPS's growth is bought versus organic. · Open the full transcript →
The resilience case: mission-critical, low-cost, and priced per retailer rather than on sales volume.
Kim Nelson (CFO): However, we believe automation and operational efficiencies across supply chains remain a priority for trading partners. Given the nominal cost of our fulfillment product relative to its value, combined with our fee structure, which is not priced on GMV, these factors have historically limited the impact on demand for SPS' mission-critical services.
p. 2 · Read in context →
The Carbon6 logic: a revenue-recovery product whose ideal customer overlaps fulfillment, opening a cross-sell.
Chad Collins (CEO); Parker Lane (Stifel): So one of the things we really liked about this emerging category of revenue recovery was that the ideal customer profile for revenue recovery and the ideal customer profile for our fulfillment product really lined up very nicely. […] And early indications are positive that our hypothesis around this alignment around the ideal customer profile will lead to cross-selling, meaning that we have successfully qualified opportunities from the fulfillment side over to the revenue recovery side and even some opportunities on revenue recovery that we think will lead to fulfillment business.
p. 3 · Read in context →
Q3 FY2024 Earnings Call — Q3 FY2024
A landmark call: the new CEO's one-year reflection, the SupplyPike acquisition, and the clearest articulation of how the multi-product platform, TAM runway, and growth algorithm fit together. · Open the full transcript →
One year in, the incoming CEO names what he sees as the durable advantage: the network effect.
Chad Collins (CEO): It's been a year since I joined SPS Commerce, and I've come to fully appreciate the power of SPS' go-to-market strategy, network effect, and unique ability to improve collaboration and data accuracy to optimize supply chain operations. As the retail industry continues to increase in complexity, naturally, SPS' role in automating trading partner relationships continues to evolve.
p. 1 · Read in context →
How the acquired products reinforce the core: Traverse scorecards surface supplier problems, SupplyPike recovers the resulting deductions.
Chad Collins (CEO); George Kurosawa (Citi): A lot of the reasons for those inefficiencies are lack of visibility or lack of performance measurements. And that's really what Traverse gets to, in that you can pull a lot of supply chain data in and produce the scorecard for your suppliers and help improve that. […] But when that supply chain performance isn't there, that could come across in the form of penalty or invoice deduction levied by the retailer. We can then help with the technology we got from SupplyPike to help the supplier side, those suppliers deal with those, either dispute them because they're incorrect, or probably more toward to this whole ecosystem help those suppliers identify the root cause of those supply chain problems that led to the deduction in the first place, and get those issues resolved. So, we can take overall friction out of the supply chain between the retailer and the supplier.
p. 4 · Read in context →
Guidance philosophy: as the customer base saturates, growth tilts from new logos toward wallet share.
Chad Collins (CEO); Joe Vruwink (Baird): Now that said, now that we have over 45,000 customers and a broader product portfolio and some things that most likely we will do over time in terms of expanding that product portfolio both organically and through M&A, I think it is logical to conclude that expanding the wallet share of those customers with a broader product portfolio will also be a lever. […] As the product portfolio gets bigger and there's a more prominent base of customers to cross-sell, it might be logical to conclude that that wallet share might start growing at a little bit faster rate than the specific customer count.
p. 8 · Read in context →
The runway question: only 45,200 of a 200,000-customer TAM, and campaigns keep landing on customers already onboard.
Chad Collins (CEO); Jeff Van Rhee (Craig-Hallum): You've got 45,200 recurring customers. And I know you've talked about 200,000 in the TAM. And with a lot of the enablement campaigns being with people that are already with you, is there something - do you consider with respect to the go-to-market that you pursue enablement campaigns potentially with retailers of a type that don't have supplier bases that are suppliers that are already in your customer count? I mean how would you get at the remaining 150,000 of 200,000 potential recurring customers? […] Your point about potentially going to some other areas, maybe kind of hunting some other ground, where there might be a lower penetration of existing SPS customers may be a tactic that we'll have to use in terms of pointing that retail sales force in some different directions.
p. 9 · Read in context →
Unit economics of the two products: fulfillment is sticky and mission-critical; analytics is smaller and more discretionary.
Chad Collins (CEO); Mark Schappel (Loop Capital): I would just point out that the analytics product, a couple of things: it's not quite as addressable in our customer base as fulfillment. […] The other point I would make on analytics is, unlike fulfillment, where it's very sticky, very mission-critical, the analytics can tend to be a little bit more discretionary. We can see if a particular set of suppliers is feeling a little bit more cost pressure, it's a little easier for them to turn on or off the analytics piece versus the fulfillment piece.
p. 10 · Read in context →
Q1 FY2024 Earnings Call — Q1 FY2024
Chad Collins's first earnings call as CEO, and the cleanest walk-through of the operating model — the two reported levers, the network effect, and the multi-source growth algorithm. · Open the full transcript →
The two levers SPS reports every quarter: recurring-customer count and wallet share (revenue per customer).
Kim Nelson (CFO): The total number of recurring revenue customers increased 5% year-over-year to approximately 44,800 and wallet share increased 13% to approximately 12,450. During the quarter, we executed a large-scale enablement campaign with a strategic retailer that rolled out a new requirement to all of their vendors. Since a large majority of those vendors are already existing SPS customers, the number of recurring revenue customers was flat sequentially, but the campaign contributed to solid growth in wallet share.
p. 2 · Read in context →
The network effect in one paragraph: customers connect to more retailers over time, lifting wallet share.
Kim Nelson (CFO); Parker Lane (Stifel): as we acquire customers over time, organic or inorganic, the same rule applies. But as you acquire customers over time, typically we get more revenue from those customers in future years as their business grows and they connect to more and more retailers. So that sort of network effect is alive and well within our business model. I'd say that's really a driver to why wallet share over time just continues to grow on a year-over-year basis.
p. 4 · Read in context →
The growth algorithm: community, channel/ERP, and marketing each feed either customer count or wallet share.
Kim Nelson (CFO); Joe Vruwink (Baird): the beauty of our model or our network is the fact that there are multiple ways in which we attract new customers, and there are multiple ways in which we drive additional revenue from those customers. If we take each of those buckets, community generally drives additional customers, usually smaller-sized customers onto our platform and into our network. […] We also see great opportunities through our channel sales to attract larger customers, usually when they're making an ERP change. […] Long-winded way to say all of those are contributors to our overall growth, and in some cases, that will translate into more customer growth; in some cases, it will translate into more wallet share.
p. 6 · Read in context →
Q4 FY2021 Earnings Call — Q4 FY2021
The founder-CEO era before the transition: Archie Black frames the network moat and the tuck-in M&A blueprint that the company still runs today. (Transcript is web-sourced and partly garbled; the excerpts below are the clean spans.) · Open the full transcript →
Founder-CEO on why the growth is structural, not a pandemic windfall.
Archie Black (CEO); Scott Berg (Needham): culmination of our investments that we've made in '16, '17, '18, '19, that really start benefiting us in 2020, 2021, 2022 and beyond. So I think some slight positives with the pandemic or acceleration in the omnichannel world, but I think it's actually more driven by our strategic initiatives.
p. 9 · Read in context →
The moat, stated plainly: rivals are software or managed-service vendors; SPS owns the network itself.
Archie Black (CEO): competitive landscape between SPS Commerce and its peers for a couple of reasons: One, this trend toward omnichannel, where we are the – we have the largest network. It's a vast network that includes both dropship e-commerce and brick-and-mortar, and then our relationships with our retailers. And so we have not seen intensified competition. […] So some of the announcements we've seen are from people that are either software-oriented or managed service oriented, so they really don't have a network. […] And that will continue, we believe, into the future, be a very strong competitive advantage for SPS Commerce.
p. 14 · Read in context →
More calls
Q1 FY2026 Earnings Call — Q1 FY2026 · 10 pages · The last quarter before the 3P divestiture, and the first framing of the Max AI rollout and the full-year 2026 guide — the setup for the Q2 FY2026 pivot. · Open →
Q4 FY2025 Earnings Call — Q4 FY2025 · 9 pages · The FY2025 wrap and the original FY2026 revenue and margin-expansion targets, before the divestiture reshaped them. · Open →
Q2 FY2025 Earnings Call — Q2 FY2025 · 9 pages · The first full quarter with Carbon6 in the base — where the reader can watch the acquisition's ARPU dilution play through the reported metrics. · Open →
Q4 FY2024 Earnings Call — Q4 FY2024 · 10 pages · FY2024 results and SPS's first full-spectrum (revenue plus EBITDA) forward guide — the change in guidance practice flagged during Q3 FY2024. · Open →
Q3 FY2021 Earnings Call — Q3 FY2021 · 26 pages · An earlier founder-era (Archie Black) call for readers who want more pre-transition context on how the network and community model was originally sold. · Open →
SPS Commerce, Inc.'s annual reports contain management's most considered account of the business. These are the sections, passages and visual pages worth opening in the originals preserved in Sources.
SPS Commerce, Inc. — FY2025 Annual Report (Form 10-K) — FY2025
Latest 10-K: the network model, a 100th-straight-quarter of growth to $751.5M revenue, and the Carbon6-driven jump in the customer base. · Open the full document →
Item 1. Business — p. 5 · Read the full section →
Management's own framing of the connect-once network, its products, and the network effect that compounds with each participant added.
The moat in the company's words: value rises exponentially with scale as trading partners are already connected.
The value of our network increases exponentially with scale. After joining, customers typically discover that many of their existing or prospective trading partners are already connected, enabling immediate transaction capability. […] As transaction volume grows among network participants through these expanded relationships, we earn additional revenue from increased activity across the network. Our customers grow their business relationships more efficiently, and we grow alongside them.
p. 7 · Read in context →
Item 1A. Risk Factors — p. 14 · Read the full section →
The two risks specific to this business: digesting a serial-acquisition strategy and defending a hub that carries partners' data.
Integration risk — SPS grows partly by buying customer bases (Carbon6, SupplyPike, Traverse, Vision33).
Fully integrating an acquired company or business into our operations may take a significant amount of time and resources. In addition, we may only be able to conduct limited due diligence on an acquired company’s operations. Following an acquisition, we may be subject to liabilities arising from an acquired company’s past or present operations, including liabilities related to data security, encryption and privacy of customer data[…]
p. 20 · Read in context →
Cyber risk — admits past cyber events and a target profile given its central role in the retail supply chain.
A failure to protect the confidentiality and integrity of our customers’ information and prevent cyber-attacks could materially damage our reputation, expose us to claims and litigation, and lead to service disruptions and harm our business. […] Given the interconnected and technology-dependent nature of the retail supply chain, our significant presence and impact in the retail industry, and past cyber events affecting our systems, it is reasonable to believe that we are a target for such attacks.
p. 26 · Read in context →
Item 7. Management's Discussion and Analysis of Financial Condition and Results of Operations — p. 39 · Read the full section →
Where management shows the P&L bridge and explains what drove 18% revenue growth — ARPU, more customers, and acquisitions.
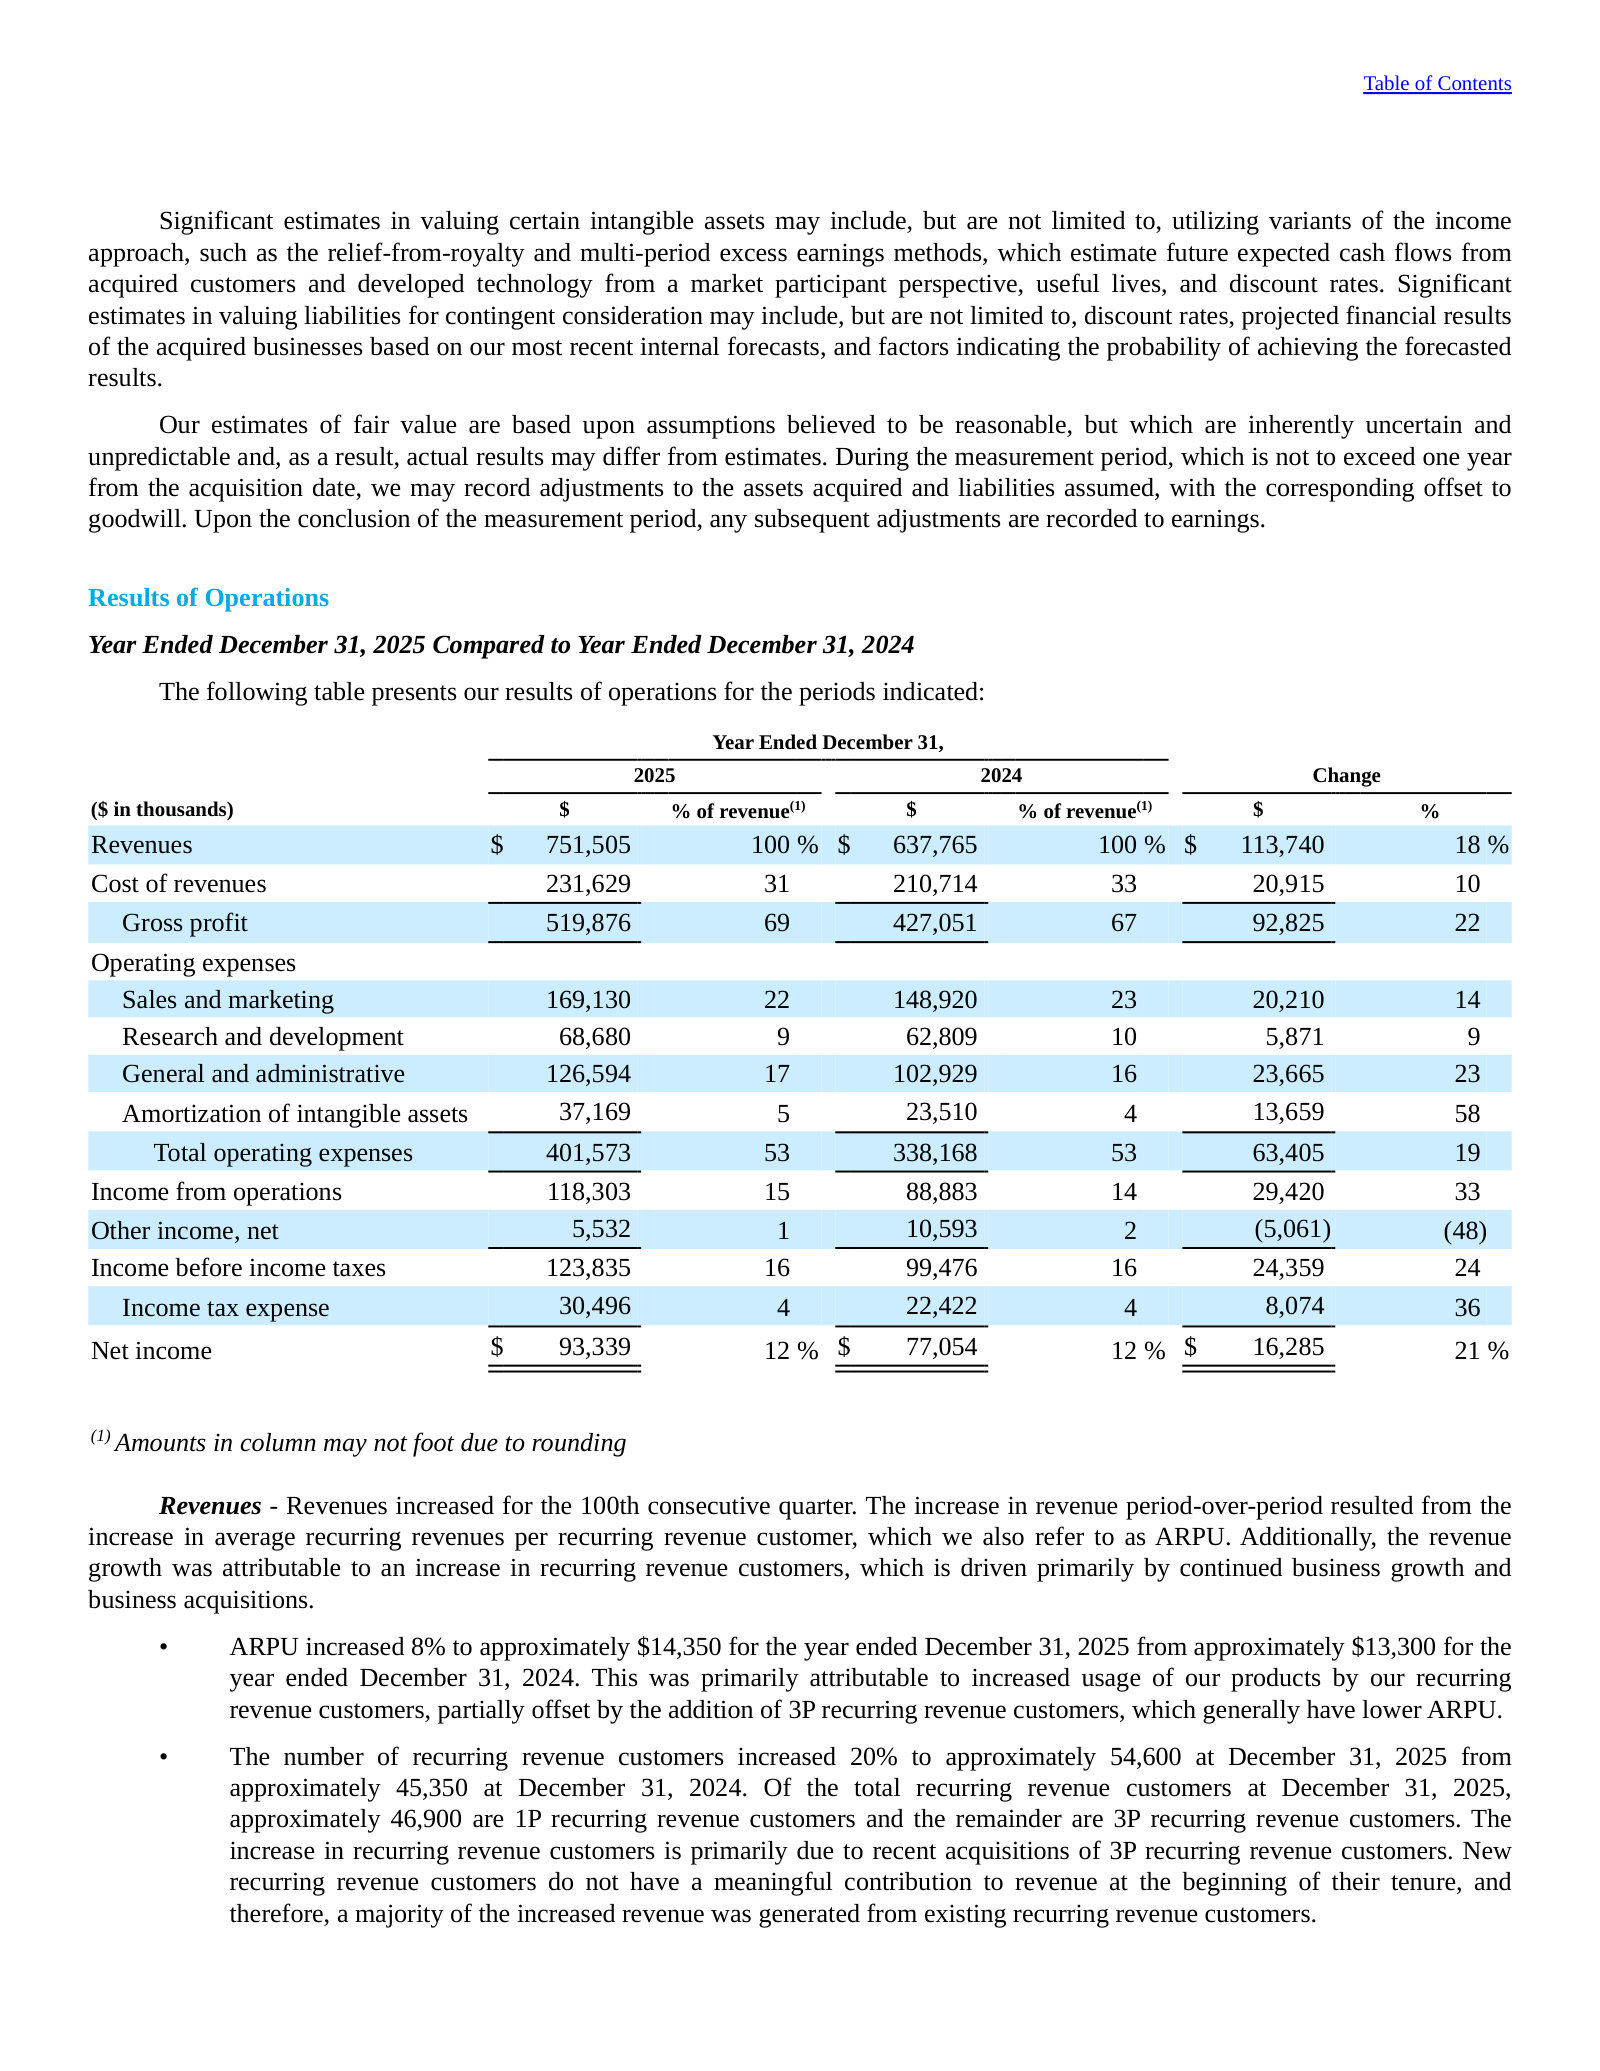
Acquisitions reshaped the customer count: ~8,500 added via Carbon6; recurring revenue up 20% to $718.0M.
Approximately 50 1P recurring revenue customers were added in May 2024 due to the acquisition of the existing customer base of Traverse Systems LLC ("Traverse Systems") and approximately 200 1P recurring revenue customers were added in July 2024 due to the acquisition of the existing customer base of SupplyPike Inc. ("SupplyPike"). Additionally, approximately 8,500 recurring revenue customers were added in February 2025 due to the acquisition of the existing customer base of Carbon6, of which approximately 300 are 1P recurring revenue customers and the remainder are 3P recurring revenue customers. […] Recurring revenues increased 20% to $718.0 million for the year ended December 31, 2025, as compared to the same period in 2024, and accounted for 96% and 94% of our total revenues in 2025 and 2024, respectively.
p. 46 · Read in context →
Critical Accounting Policies and Estimates — p. 42 · Read the full section →
Revenue recognition defines the subscription model — nonrefundable set-up fees deferred and recognized ratably over ~two years.
More annual reports
SPS Commerce, Inc. — FY2024 Annual Report (Form 10-K) — FY2024 · 101 pages · Prior year ($637.8M revenue): the SupplyPike and Traverse Systems acquisitions before Carbon6 scaled the base. · Open →
SPS Commerce, Inc. — FY2023 Annual Report (Form 10-K) — FY2023 · 99 pages · $536.9M revenue year; useful baseline before the FY2024–FY2025 acquisition wave. · Open →
SPS Commerce, Inc. — FY2022 Annual Report (Form 10-K) — FY2022 · 101 pages · Shows the business description and network narrative before the 'Relationship Management' rebrand of Community. · Open →
SPS Commerce, Inc. — FY2021 Annual Report (Form 10-K) — FY2021 · 95 pages · Earliest edition on the shelf ($385.3M revenue, 84th consecutive quarter) — the pre-scale starting point. · Open →
Competitors describe SPS Commerce, Inc.'s market in their own filings and calls. These verified passages and visual pages show where their strategies meet, using source documents preserved in Sources.
Open Text Corporation (OTEX)
The peer SPS Commerce names by name in its 10-K competition section. OpenText's Business Network Cloud (the former GXS/Trading Grid) is a pre-built B2B/EDI network selling the same core promise as SPS — onboarding trading partners, electronic invoicing and managed EDI — making it the closest strategic collision in the set.
OpenText's own description of its Business Network Cloud and 'Trading Grid' network — framed around exactly SPS Commerce's value proposition: rapidly onboarding trading partners, electronic invoicing and simplifying B2B data exchange across a pre-built network.
Organizations of all sizes can build global and sustainable supply chains, rapidly onboard new trading partners, comply with regional mandates, assess their credit quality and ethics scores, provide electronic invoicing and remove information silos across ecosystems and the extended enterprise.
The foundation of our Business Network Cloud is our Trading Grid, which connects businesses, trading partners, transportation and logistics companies, financial institutions and government organizations globally. […] The Business Network Cloud can be accessed through our new multi-tenant, selfservice Foundation offering or as a managed service to simplify the inherent complexities of business-to-business (B2B) data exchange.
p. 9 · Read in context →
On its Q3 FY2026 call OpenText credits a Michelin expansion to rising e-invoicing adoption and B2B-workflow integration on its business network — the same regulatory-and-connectivity demand SPS sells into.
Michelin navigated an increase of market consumption for e-invoices that required integration with Microsoft and our business network as part of the company's innovation program. Through their expanded relationship with OpenText, Michelin can capitalize on the implementation of our business network for self-service, apply AI to those B2B workflows, and supply chain use cases supporting their business needs.
p. 10 · Read in context →
Manhattan Associates, Inc. (MANH)
Manhattan sells cloud supply-chain-commerce software to the same retailers, suppliers and distributors as SPS, and its platform includes a named 'Trading Partner Management' module plus omnichannel order management — overlapping SPS's fulfillment-and-connectivity turf in the fragmented market SPS's 10-K describes.
Manhattan's own business definition: a supply-chain-commerce provider coordinating data exchange among the same participants SPS connects — suppliers, distributors, trading partners and store retailers — in a market it calls 'highly competitive.'
Manhattan Associates, Inc. (“Manhattan”, the “Company”, “we”, “our”, or “us”) is a developer and provider of supply chain commerce solutions that help organizations optimize the effectiveness, efficiency, and strategic advantages of their supply chains. Our solutions consist of software, services, and hardware, which coordinate people, workflows, assets, events, and tasks holistically across the functions linked in a supply chain from planning through execution. These solutions also help coordinate the actions, data exchange, and communication of participants in supply chain ecosystems, such as manufacturers, suppliers, distributors, trading partners, transportation providers, channels (such as catalogers, store retailers, and Web outlets), and consumers. […] The markets for supply chain commerce solutions are highly competitive, subject to rapid technological change, changing customer needs, frequent new product introductions, and evolving industry standards that may render existing products and services obsolete.
p. 85 · Read in context →
Manhattan's product footprint touching SPS's domain: a named 'Trading Partner Management' capability within its SCALE suite, plus an omnichannel Order Management and fulfillment application.
SCALE combines the features of Trading Partner Management, Yard Management, Optimization, Warehouse Management, and Transportation Execution. […] Our Manhattan Active Omni set of solutions brings together Order Management, Store Inventory & Fulfillment, POS, and Customer Engagement tools into a single application built on a shared, cloudnative, microservices platform.
p. 9 · Read in context →
On its Q4 FY2025 call Manhattan reports competitive win rates above 70% and net-new-logo-led bookings — its stated evidence of share gains in the supply-chain-commerce market it shares with SPS.
Eric Clark, President & CEO: In Q4, competitive win rates remained over 70% and more than 75% of our new cloud bookings were generated from net new logos. For the full year, our team did a fantastic job gaining market share as new logos represented more than 55% of our 2025 new cloud bookings.
p. 2 · Read in context →
More peer documents
OpenText FY2024 10-K — Business Network Cloud description (pp.8-10) — 213 pages · Prior-year framing of the same Trading Grid / B2B managed-services network; check for strategy or wording shifts year over year. · Open →
Descartes Q3 FY2026 call — GLN as data source for AI (pp.5-6) — 32 pages · Fuller CEO narrative on why the logistics network's proprietary data becomes more valuable in an AI world. · Open →
Manhattan Q1 FY2026 call — Active Agent/Foundry and retail wins (p.2) — 12 pages · Management color on AI-agent commercialization and retail/grocery customer wins in the overlapping market. · Open →
Source: S&P Capital IQ consensus via Xpressfeed · Generated 2026-08-02.
The tape is splitting: analysts have been marking revenue estimates lower over the past six months while nudging normalized EPS higher, a margin-driven revision cycle. That reads directly in the print record, where SPS has beaten on normalized EPS every quarter for two years, mostly by double digits, even as revenue merely meets consensus. The street stays cautious on it, with eight of twelve ratings at hold and targets ranging from 59 to 103.
FY2027 EPS estimates up ~3% over six months while revenue estimates fall ~3%
The same divergence holds for FY2028, where revenue has been cut from 937 to 904 since February while EPS sits roughly flat. Lower revenue with steady-to-higher EPS points to margin, not top-line, as the source of the upgrades.
Currency: USD · Scale: money in millions, absolute · Point-in-time consensus; Δ90d is Now versus 90d.
| Metric | FY | 180d | 90d | 30d | Now | Δ90d |
|---|---|---|---|---|---|---|
| EPS (normalized) | FY2027 | $5.16 | $5.24 | $5.22 | $5.31 | +1.4% |
| EPS (normalized) | FY2028 | — | $6.04 | $5.99 | $6.00 | -0.7% |
| Revenue | FY2027 | $870.46m | $855.07m | $852.51m | $841.24m | -1.6% |
| Revenue | FY2028 | $937.00m | $925.75m | $918.70m | $903.76m | -2.4% |
Normalized EPS has beaten every quarter for two years while revenue only meets
Revenue surprises stay inside roughly plus or minus 2%, so the earnings upside is coming from margin rather than volume — consistent with the estimate momentum above.
Current sequences by metric: Revenue: 1 consecutive beat; EPS (normalized): 8 consecutive beats.
Currency: USD · Scale: money in millions, absolute · Consensus is captured before each actual first became effective.
| Quarter | Metric | Consensus | Actual | Surprise | Outcome |
|---|---|---|---|---|---|
| Q2 FY2026 | Revenue | $195.45m | $197.81m | +1.2% | Beat |
| Q2 FY2026 | EPS (normalized) | $1.09 | $1.27 | +16.0% | Beat |
| Q1 FY2026 | Revenue | $192.71m | $192.12m | -0.3% | Miss |
| Q1 FY2026 | EPS (normalized) | $0.98 | $1.10 | +12.5% | Beat |
| Q4 FY2025 | Revenue | $193.60m | $192.65m | -0.5% | Miss |
| Q4 FY2025 | EPS (normalized) | $1.01 | $1.14 | +13.1% | Beat |
| Q3 FY2025 | Revenue | $192.68m | $189.90m | -1.4% | Miss |
| Q3 FY2025 | EPS (normalized) | $1.00 | $1.13 | +13.3% | Beat |
| Q2 FY2025 | Revenue | $185.83m | $187.40m | +0.8% | Beat |
| Q2 FY2025 | EPS (normalized) | $0.91 | $1.00 | +10.3% | Beat |
| Q1 FY2025 | Revenue | $179.02m | $181.55m | +1.4% | Beat |
| Q1 FY2025 | EPS (normalized) | $0.85 | $1.00 | +18.1% | Beat |
| Q4 FY2024 | Revenue | $169.29m | $170.91m | +1.0% | Beat |
| Q4 FY2024 | EPS (normalized) | $0.87 | $0.89 | +2.8% | Beat |
| Q3 FY2024 | Revenue | $160.30m | $163.69m | +2.1% | Beat |
| Q3 FY2024 | EPS (normalized) | $0.83 | $0.92 | +11.3% | Beat |
Revenue compounds ~6-7% a year as EBITDA and EPS climb faster on margin expansion
Implied EBITDA margin rises from roughly 34% in FY2026 toward 36% by FY2028, the mechanism behind EPS growing faster than revenue.
Currency: USD · Scale: money in millions, absolute · YoY uses the prior fiscal year from the feed; analyst count and range use the first displayed period.
| Metric | FY2026E | FY2027E | FY2028E | YoY | Analysts | Low / high |
|---|---|---|---|---|---|---|
| Revenue | $791.20m | $841.24m | $903.76m | +5.3% | 12 | $789.80m / $796.05m |
| EBITDA | $266.55m | $293.94m | $329.12m | +15.2% | 8 | $265.87m / $267.70m |
| EPS (normalized) | $4.91 | $5.31 | $6.00 | +15.0% | 11 | $4.88 / $5.02 |
Street sits mostly on the sidelines: eight holds of twelve, one sell, targets 59-103
Currency: USD · Scale: money in millions, absolute · Analyst counts shown explicitly.
| Street view | Reading | Analysts |
|---|---|---|
| Recommendation mix | Buy 2, Outperform 1, Hold 8, Underperform 0, Sell 1 | 12 |
| Consensus score | 2.75 | 12 |
| Target price | mean $72.73; median $70.00; high $103.0; low $59.00 | 11 |
Outer-year coverage thins sharply into FY2028
FY2028 revenue, EBITDA and normalized EPS each carry only about five analysts, and GAAP net income just three, versus nine to twelve for FY2027. Treat the FY2028 column as thin consensus, not a firm base.
Visible Alpha broker models via S&P Xpressfeed · 9 brokers · 347 line items · freshest revision 2026-07-31.
Broker models paint SPS Commerce as a subscription supply-chain network compounding revenue in the mid-single digits, with recurring revenue over 90% of the total. The differentiated signal is in the composition: the models grow the top line on rising revenue-per-customer rather than customer additions, and they show operating margins bending steadily higher across the forecast.
The growth engine flipped: revenue keeps compounding while the customer base shrinks
The FY-2026 reversal is the story: modeled net new customers swing from +9,550 (FY-2025 median) to -7,650, as SPS is expected to shed smaller accounts, while annualized recurring revenue per customer climbs double digits and carries the top line.
| Line | FY-2025A | FY-2026E | FY-2027E | FY-2028E | YoY | Brokers |
|---|---|---|---|---|---|---|
| Top line | — | — | — | — | — | — |
| Revenue | $752.41m | $790.51m | $843.14m | $906.58m | +5.1% | 9 |
| Revenue - Recurring | $719.84m | $759.54m | $810.70m | $869.38m | +5.5% | 8 |
| Per customer | — | — | — | — | — | — |
| Annualized average recurring revenue per customer | $13.69m | $15.36m | $17.00m | $18.32m | +12.2% | 7 |
| Recurring revenue customers - end(#) | 54,950 Number | 47,656 Number | 48,400 Number | 48,440 Number | -13.3% | 7 |
| Net new customers(#) | 9,600 Number | -6,944 Number | 744.7 Number | 772.8 Number | -172.3% | 8 |
Fulfillment carries the model; Analytics is barely credited
Fulfillment is the bulk of recurring revenue and the only line growing at a healthy clip; Analytics is modeled roughly flat and non-recurring revenue drifts lower. These splits rest on only four to five brokers.
| Line | FY-2025A | FY-2026E | FY-2027E | FY-2028E | YoY | Brokers |
|---|---|---|---|---|---|---|
| Recurring | — | — | — | — | — | — |
| Revenue - Recurring - Fulfillment | $639.11m | $677.71m | $725.99m | $781.21m | +6.0% | 5 |
| Revenue - Recurring - Analytics | $56.23m | $57.18m | $59.01m | $60.63m | +1.7% | 5 |
| Revenue - Recurring - Other | $24.48m | $25.18m | $25.62m | $27.54m | +2.8% | 5 |
| Non-recurring | — | — | — | — | — | — |
| Revenue - Nonrecurring | $32.58m | $30.86m | $31.20m | $31.20m | -5.3% | 8 |
Margins bend up across the P&L, stepping the cash line higher
The operating-adjusted margin ladder is the clearest consensus in the feed: gross margin, operating margin and free cash flow per share all step up each year, even as the customer count falls.
| Line | FY-2025A | FY-2026E | FY-2027E | FY-2028E | YoY | Brokers |
|---|---|---|---|---|---|---|
| Margins | — | — | — | — | — | — |
| Gross profit/(loss) margin - Operating(%) | 70.3% | 71.7% | 72.0% | 73.2% | +1.4pt | 8 |
| Operating income/(loss) margin - Operating(%) | 27.7% | 30.6% | 32.1% | 33.8% | +2.8pt | 9 |
| Cash | — | — | — | — | — | — |
| Free cash flow | $175.40m | $201.77m | $219.69m | $249.29m | +15.0% | 8 |
| Free cash flow per share($) | $4.59 | $5.35 | $6.12 | $6.78 | +16.5% | 5 |
Brokers agree on revenue but split on how it is built — and on cash conversion
One broker does not model the customer cull as deep, holding the base well above the median and pulling the range wide; the same disagreement flips into per-customer ARR. Coverage here is only five to six brokers.
| Line | Period | Median | Q1–Q3 | Min–max | Brokers |
|---|---|---|---|---|---|
| Recurring revenue customers - end(#) | FY-2026E | 46,950 Number | 46,820 Number–46,980 Number | 46,750 Number–50,778 Number | 5 |
| Recurring revenue customers - end(#) | FY-2027E | 47,522 Number | 47,445 Number–47,890 Number | 47,350 Number–51,794 Number | 5 |
| Annualized average recurring revenue per customer | FY-2027E | $17.20m | $17.10m–$17.36m | $15.88m–$17.49m | 5 |
| Free cash flow | FY-2027E | $217.71m | $211.94m–$224.74m | $206.60m–$239.03m | 6 |
Coverage thins fast in the out-years and on the segment and customer lines
Forward periods were refreshed on 2026-07-31, so the vintage is current, but FY-2028 is only two or three analysts and the segment splits, customer counts and ARPU lines rest on four to five brokers. Treat those as directional, not consensus.
Headline P&L consensus, momentum and beat/miss live in the CapIQ tab.
Source: S&P Capital IQ transcripts via Xpressfeed · latest indexed call 2026-07-30 · generated 2026-08-02.
Latest call digest
SPS Commerce, Inc., Q2 2026 Earnings Call, Jul 30, 2026 · 2026-07-30T20:30:00
Q2 2026 (reported Jul 30, 2026). The story of the call is the split between a polished, AI-forward prepared script and a Q&A that circled almost entirely around the June 30 divestiture of the 3P revenue-recovery business. Chad Collins spent his remarks on MAX (the network AI agent), the first fully AI-powered customer onboarding, an analytics replatform, and a string of customer ROI anecdotes. Joe Del Preto reported revenue of $197.8 million (+6%), adjusted EBITDA of $66.6 million, free cash flow of $57.4 million (trailing-12-month FCF $198.7 million, up 40%), and nearly 90% of FCF ($51.2 million) deployed to buybacks. The 3P sale brought $9.5 million cash at closing and a $23.5 million loss on sale.
In Q&A, the harder questions were financial and definitional rather than strategic. Analysts pressed on why divest 3P now, on an ARPU figure that skewed high (full-quarter 3P revenue divided by a post-divestiture customer count), on a 1P customer count down ~200–250 sequentially, and on why the Q2 beat was not fully flowed through to second-half EBITDA. Guidance actually stated: Q3 2026 revenue of $196.3–198.3 million; full-year 2026 revenue of $788.4–793.4 million (~5% headline growth, high-single-digit ex-divestiture) and an adjusted EBITDA margin of 34% at the midpoint, up roughly 300 basis points. Management framed macro as benign ("no substantial headwinds") and put MAX general availability at end of summer with monetizable autonomous agents targeted for late Q4.
Participant coverage from the latest call.
| Group | Participants | Count |
|---|---|---|
| Management | Operator; Irmina Blaszczyk — Managing Director, The Blueshirt Group, LLC; Chad Collins — CEO & Director, SPS Commerce, Inc.; Joseph Del Preto — Executive VP & CFO, SPS Commerce, Inc. | 4 |
| Analysts | Scott Berg — Senior Analyst, Needham & Company, LLC, Research Division; Jackson Bogli — Associate, William Blair & Company L.L.C., Research Division; Christopher Quintero — Equity Analyst, Morgan Stanley, Research Division; George Michael Kurosawa — Research Analyst, Citigroup Inc., Research Division; J. Lane — Director, Stifel, Nicolaus & Company, Incorporated, Research Division; Matthew VanVliet — Research Analyst, Cantor Fitzgerald & Co., Research Division; Mark Schappel — Managing Director, Loop Capital Markets LLC, Research Division; Daniel Hibshman — Research Analyst, Craig-Hallum Capital Group LLC, Research Division; Lachlan Brown — Research Analyst, Rothschild & Co Redburn, Research Division; Nehal Chokshi — MD & Senior Research Analyst, Northland Capital Markets, Research Division; Clark Wright — Senior Research Associate, D.A. Davidson & Co., Research Division | 11 |
Curated latest-call exchanges; one row per analyst topic.
| Analyst | Firm | Topic | What changed in Q&A |
|---|---|---|---|
| Scott Berg | Needham & Company | Rationale for the 3P revenue-recovery divestiture | Asked why exit now after being positive on revenue recovery. Chad said the 1P side overlaps the ideal customer profile and full portfolio, while the 3P Amazon-marketplace base had little overlap and faced take-rate and Amazon policy pressure. |
| Scott Berg | Needham & Company | ARPU distortion and Q3 revenue step-down | Pressed on whether ARPU was calculated differently. Joe said the method was unchanged; ARPU skewed high because full-period 3P revenue was divided against a customer count that excluded the ~7,300 divested accounts at quarter end. |
| George Michael Kurosawa | Citigroup | Why the Q2 EBITDA beat was not fully flowed to 2H guidance | Noted the revenue beat flowed through but the EBITDA beat did not. Joe attributed it to expenses shifting from Q2 into Q3/Q4 and to deliberate prudence on internal AI investment costs. |
| Christopher Quintero | Morgan Stanley | Macro backdrop and the sequential 1P customer decline | Chad reported no substantial macro headwinds and attributed the ~200 sequential 1P decline to retail-enablement program timing and churn concentrated in very low-ARPU customers. |
| Daniel Hibshman | Craig-Hallum Capital Group | Drivers of the larger-than-recent beat | Joe credited gross-retention strength (absence of the 2025-style downsell pressure) plus land-and-expand trading-partner additions within the existing base. |
| Matthew VanVliet | Cantor Fitzgerald | MAX monetization and ARPU uplift | Asked how much annual uplift adopting tiers could deliver. Chad said agents should be sellable by late Q4 but that the specific ARPU uplift details are still being worked out, declining to quantify. |
Theme tracker
Themes are curator-classified across supplied calls.
| Theme | Status | Quarters mentioned | Read-through |
|---|---|---|---|
| Revenue recovery (SupplyPike / Carbon6) and the Amazon 3P unwind | persisted | Q3 2024, Q4 2024, Q1 2025, Q2 2025, Q3 2025, Q4 2025, Q1 2026, Q2 2026 | Entered via SupplyPike (2024) and Carbon6 (early 2025) and framed as a $750M market and clear leadership. Amazon 3P take-rate weakness became the recurring drag through 2025, leading to a 3P subscription fee in Q1 2026 and, finally, the divestiture of the 3P business at a loss in Q2 2026. The arc matters because the acquisition thesis was re-cut from 'clear leadership' to 'sharpened focus' on 1P within about 18 months. |
| MAX agentic AI and network-data monetization | emerged | Q4 2025, Q1 2026, Q2 2026 | Launched Q4 2025, grew to 400+ beta customers by Q1 2026, and by Q2 2026 was headed to general availability by end of summer with paid autonomous agents targeted for late Q4 2026. Now the central forward narrative, but monetization is still prospective and management has not sized the ARPU uplift. |
| Tariff-driven spend scrutiny, downsell and contract rightsizing | persisted | Q2 2025, Q3 2025, Q4 2025, Q1 2026, Q2 2026 | First flagged as monitoring in Q1 2025, it became an active supplier-side headwind in Q2 2025 and pressured document volumes and analytics through 2025. By 2026 management describes it as one-time and largely lapped, supporting an implied second-half reacceleration. |
| Internal AI for efficiency and margin | emerged | Q3 2025, Q1 2026, Q2 2026 | Introduced as an efficiency lever in Q3 2025 and elevated by the new CFO in Q1 2026. Notably, in Q2 2026 Joe clarified that the margin gains to date come from scale and process discipline rather than internal AI, positioning AI as additive rather than proven. |
| Retail enablement campaign timing and customer-count noise | persisted | Q2 2024, Q3 2024, Q4 2024, Q1 2025, Q3 2025, Q4 2025, Q1 2026, Q2 2026 | Enablement (community/relationship management) programs are the main source of new logos, and their timing repeatedly shifts customer-count contribution between quarters and years. Management consistently frames the slippage as billing-timing rather than lost demand. |
| 15%-or-greater revenue growth target | dropped | Q2 2024, Q3 2024, Q4 2024 | The long-standing '15% or greater' annual growth framework was stated through late 2024, then quietly replaced beginning Q2 2025 with an 'at least high single digits' organic (ex-acquisition) framework. The disappearance signals a genuine reset in the growth algorithm, not just softer phrasing. |
| Europe / international expansion (TIE Kinetix) | dropped | Q2 2024, Q3 2024, Q4 2024 | Featured prominently in 2024 as a fulfillment beachhead and a 2025 go-to-market vector, but it has faded from prepared remarks since, surfacing only as a longer-term M&A option. Worth watching as a de-emphasized growth lever. |
Guidance ledger
Quotes, calls, and speakers are source-verified; outcomes are curator-classified.
| Verbatim guidance | Call | Speaker | Curator outcome | Outcome note |
|---|---|---|---|---|
| “we expect revenue to be in the range of $758 million to $763 million, representing approximately 19% to 20% growth over 2024.” | SPS Commerce, Inc., Q4 2024 Earnings Call, Feb 10, 2025 · 2025-02-10T21:30:00 | Kimberly Nelson | missed | Full-year 2025 revenue finished at $751.5 million (18% growth), below this guided range; the range was cut during the year as revenue-recovery and spend-scrutiny headwinds built. |
| “We expect adjusted EBITDA to be in the range of $227.5 million to $231 million, representing growth of approximately 22% to 24% over 2024.” | SPS Commerce, Inc., Q4 2024 Earnings Call, Feb 10, 2025 · 2025-02-10T21:30:00 | Kimberly Nelson | kept | Full-year 2025 adjusted EBITDA came in at $231.4 million (up 24%), at/just above the top of this range even as revenue landed below guidance. |
| “we are providing our initial outlook for 2026 and expect to deliver revenue growth without future acquisitions of approximately 7% to 8%.” | SPS Commerce, Inc., Q3 2025 Earnings Call, Oct 30, 2025 · 2025-10-30T20:30:00 | Kimberly Nelson | pending | The 2026 headline revenue guide was later reduced to roughly 5% growth after the 3P divestiture; management maintains the core business ex-divestiture is growing high single digits. |
| “we expect revenue to be in the range of $798.5 million to $806.9 million, representing approximately 7% growth over 2025 at the midpoint of the guided range.” | SPS Commerce, Inc., Q4 2025 Earnings Call, Feb 12, 2026 · 2026-02-12T21:30:00 | Kimberly Nelson | pending | This full-year 2026 guide was subsequently lowered to $796.0-802.0 million in Q1 2026 and to $788.4-793.4 million in Q2 2026 following the 3P divestiture. |
| “We expect to increase our adjusted EBITDA margin by 2 percentage points annually as we remain committed to steady margin expansion” | SPS Commerce, Inc., Q4 2025 Earnings Call, Feb 12, 2026 · 2026-02-12T21:30:00 | Chad Collins | pending | The Q2 2026 full-year guide implies roughly 300 basis points of adjusted EBITDA margin expansion (34% midpoint) for 2026, tracking ahead of the 2-point commitment. |
| “We expect this change to increase churn within this cohort with a projected decline of up to 4,000 3P suppliers in 2026. We do not anticipate this action to result in a material impact to revenue.” | SPS Commerce, Inc., Q1 2026 Earnings Call, Apr 30, 2026 · 2026-04-30T20:30:00 | Joseph Del Preto | unknown | Superseded before it could fully play out: the entire 3P revenue-recovery business (~7,300 customers) was divested on June 30, 2026. |
| “For the full year 2026, we expect revenue to be in the range of $788.4 million to $793.4 million, representing approximately 5% growth over 2025 at the midpoint of the guided range.” | SPS Commerce, Inc., Q2 2026 Earnings Call, Jul 30, 2026 · 2026-07-30T20:30:00 | Joseph Del Preto | pending | Most recent full-year guide; reflects a roughly $10.5 million second-half reduction from the 3P divestiture, with the core business guided to high-single-digit growth. |
Q&A pressure map
Question counts and firms are curator tallies; analyst coverage shown above.
| Topic | Questions | Firms | Pressure / response |
|---|---|---|---|
| Revenue recovery: Amazon 3P headwinds, seasonality, churn and the divestiture | 12 | Needham & Company, Citigroup, William Blair, Robert W. Baird, Stifel, Cantor Fitzgerald, Craig-Hallum Capital Group | The single most-pressed subject from Q3 2025 through Q2 2026. Analysts probed the Q3 2025 seasonality/shipment miss, Amazon policy impact, the projected 4,000-supplier churn, and finally the rationale and ARPU optics of the June 2026 divestiture. |
| MAX / AI adoption, packaging and monetization | 8 | Needham & Company, William Blair, Morgan Stanley, Rothschild & Co Redburn, Citigroup, Cantor Fitzgerald, D.A. Davidson | Repeated attempts to get management to quantify the ARPU uplift from MAX. Management has consistently declined to size it, pointing to bundling/tiering and autonomous agents still being worked out; it addresses the question qualitatively rather than with numbers. |
| Medium-term growth algorithm and ARPU-versus-customer mix | 8 | Needham & Company, Citigroup, Northland Capital Markets, Morgan Stanley, D.A. Davidson | Analysts pushed on the shift to high-single-digit growth and the split between customer adds and ARPU. When asked in Q1 2026 whether the core business would inflect above high single digits in Q3, Joe declined to answer beyond the annual guide. |
| Enablement campaign timing and customer-count trajectory | 8 | Citigroup, Morgan Stanley, Northland Capital Markets, William Blair, Needham & Company, Craig-Hallum Capital Group | Recurring skepticism about programs slipping from quarter to quarter. Management repeatedly reframes the slippage as billing-timing rather than lost demand, but the questions returned each quarter as counts stayed lumpy. |
| Margin, EBITDA flow-through and guidance conservatism | 8 | Needham & Company, Cantor Fitzgerald, Stifel, Northland Capital Markets, William Blair, Citigroup | Analysts repeatedly asked why beats were not fully flowed through and where margin leverage comes from. Answers pointed to gross-margin scaling and, more recently, deliberate room left for internal AI spend. |
Language shifts
Only language evidence verified against the referenced component is shown.
| Observation | Verbatim evidence | Call ID | Component |
|---|---|---|---|
| Caution vocabulary entered the script in mid-2025, with management describing supplier behavior in terms of aggressive cost-cutting rather than business-as-usual. | “quickly turn to uncertainty trying to be addressed by a pretty aggressive cost savings measure, specifically on the supplier side” | 1953554754 | 8 |
| By the Q4 2025 call the caution was formalized in the prepared remarks, tying the year's weakness explicitly to tariffs, spend scrutiny and delayed purchasing. | “a challenging macroeconomic backdrop and tariff-related uncertainty, which contributed to spend scrutiny and delayed purchase decisions throughout the year” | 1981934561 | 2 |
| In early 2026 management began reframing the 2025 pressure as one-time and forecasting a reacceleration, a forward-looking confidence shift. | “It appears that those are more onetime in nature for 2025, and that will lead to a reacceleration in the back half of '26.” | 1995728884 | 61 |
| By Q2 2026 the macro language had turned outright benign, a clear contrast to the spend-scrutiny tone of 2025. | “no substantial headwinds we're hearing from our customers relative to the macro” | 2011002162 | 18 |
| The revenue-recovery framing reversed from 2025's 'clear leadership' to a post-divestiture 'sharpened focus' on 1P, language that acknowledges the 3P bet did not fit. | “Having recently divested the 3P revenue recovery business, we have sharpened focus on strategic relationships with 1P suppliers” | 2011002162 | 2 |
The 12-quarter arc shows a company that rode M&A-fueled 18-24% growth in 2024-2025 into a high-single-digit organic reset, retired its 15%-plus target, and exited the Amazon 3P revenue-recovery bet at a loss within roughly 18 months of calling it clear leadership. Against that, margin execution has been the steady constant, with EBITDA guides held even when revenue slipped. For the current debate, the history favors operational discipline and a sticky core network, while the promised second-half reacceleration and MAX/AI monetization remain unproven.