SPS Commerce, Inc.'s management explains the business in its own materials. The slides below do the most of that work, pulled from the documents preserved in Sources. Each source link opens the complete presentation at that slide in a new tab.
Management's fullest current explanation of the business — strategy, products, the network, go-to-market and the financial model. · Open the full document →
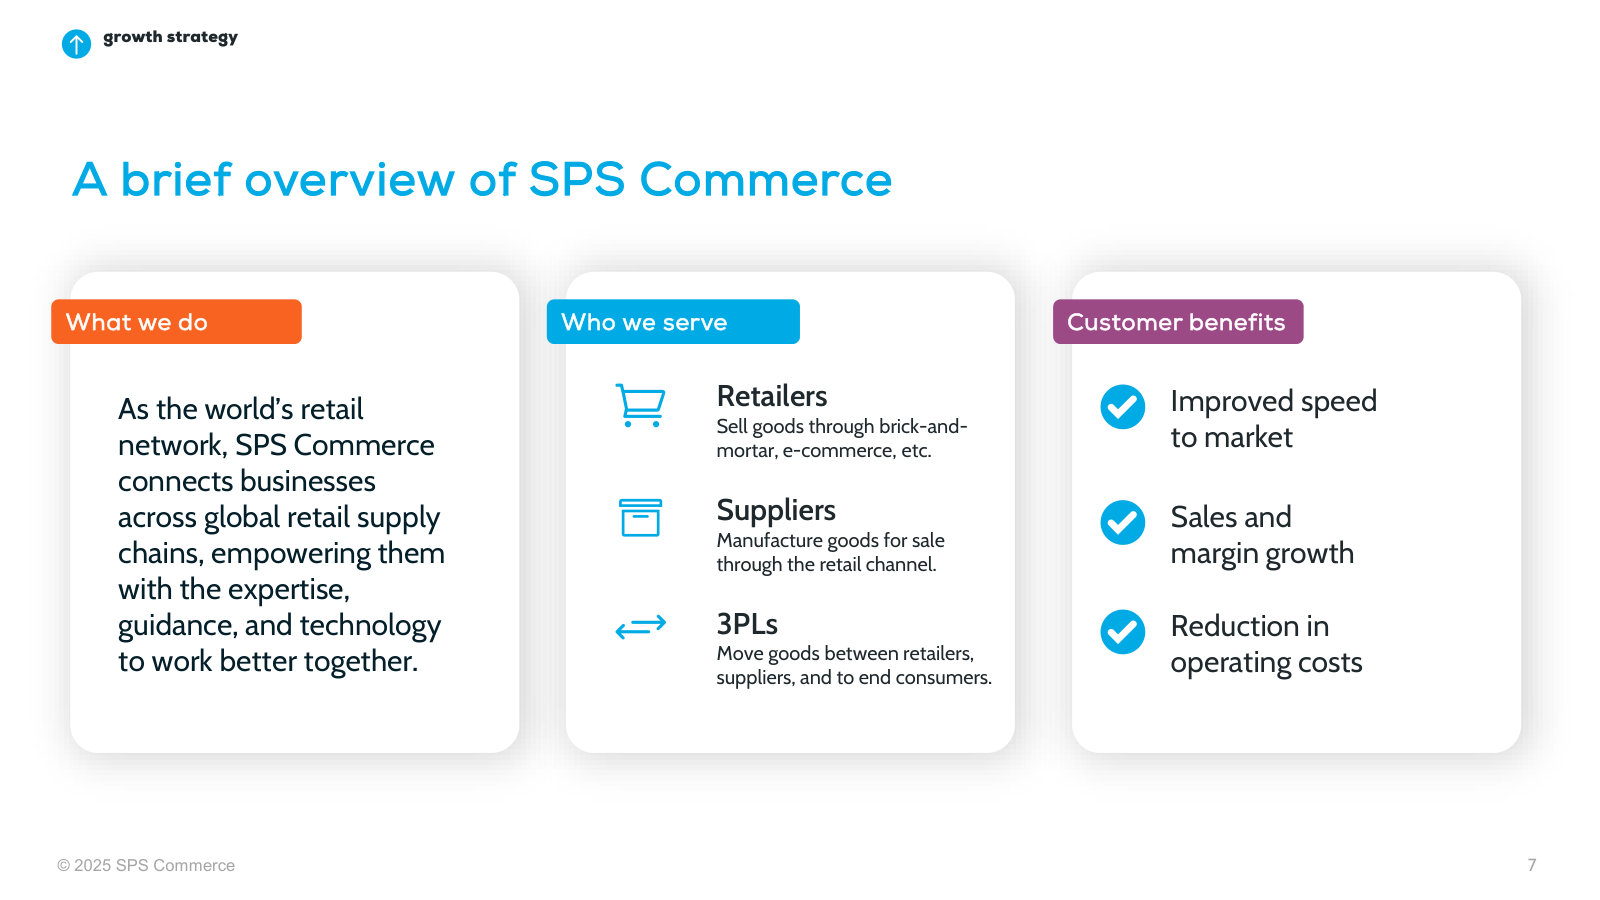
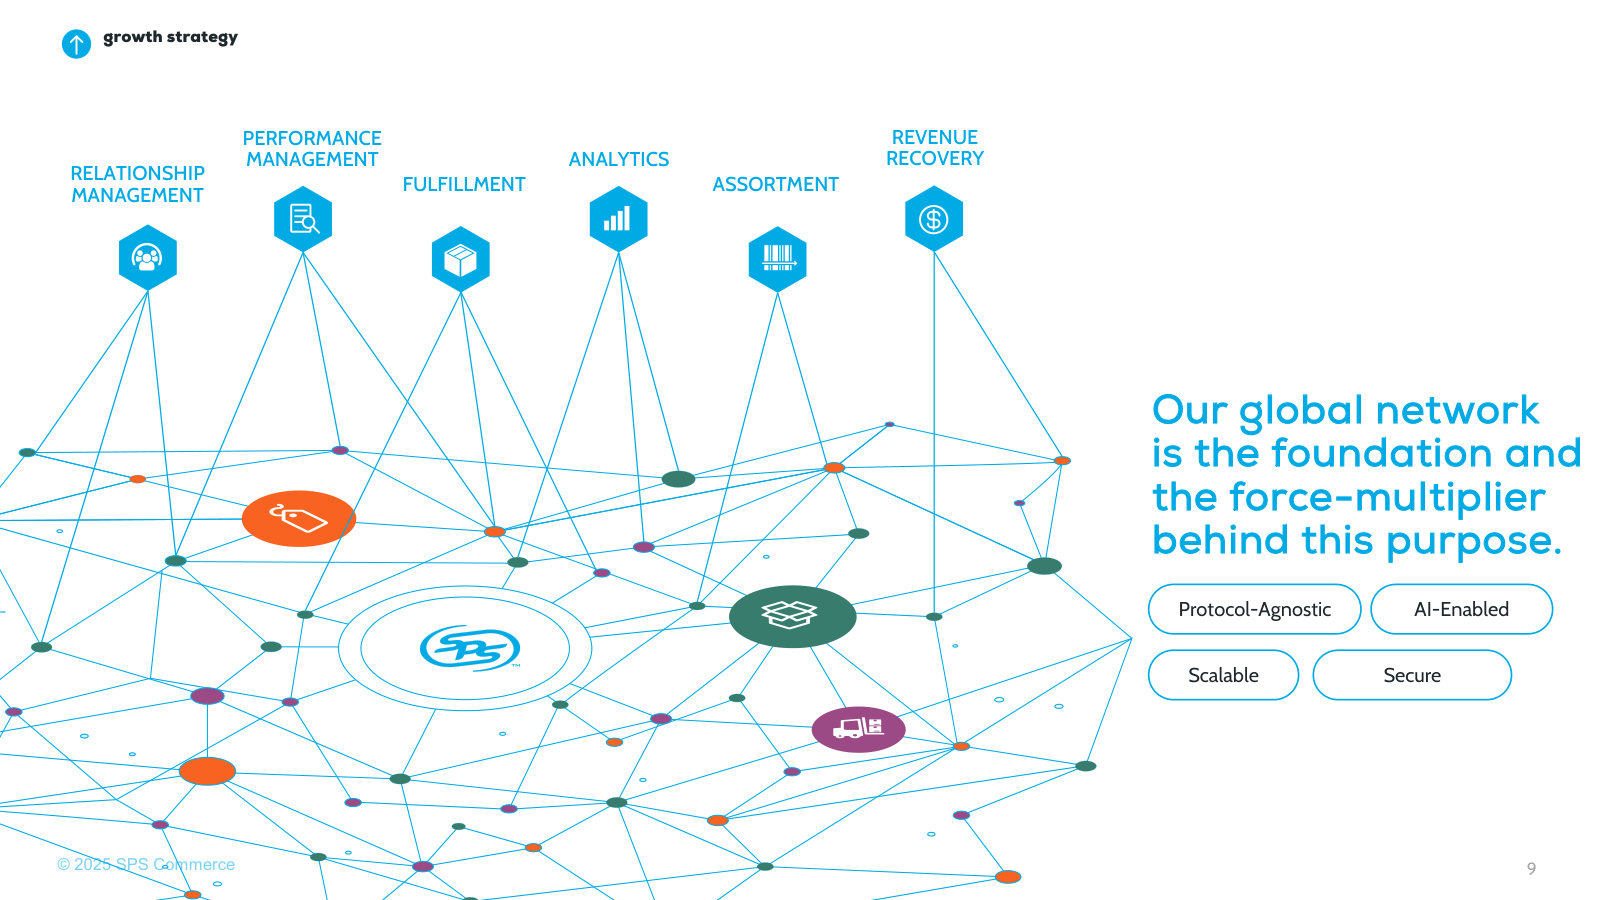
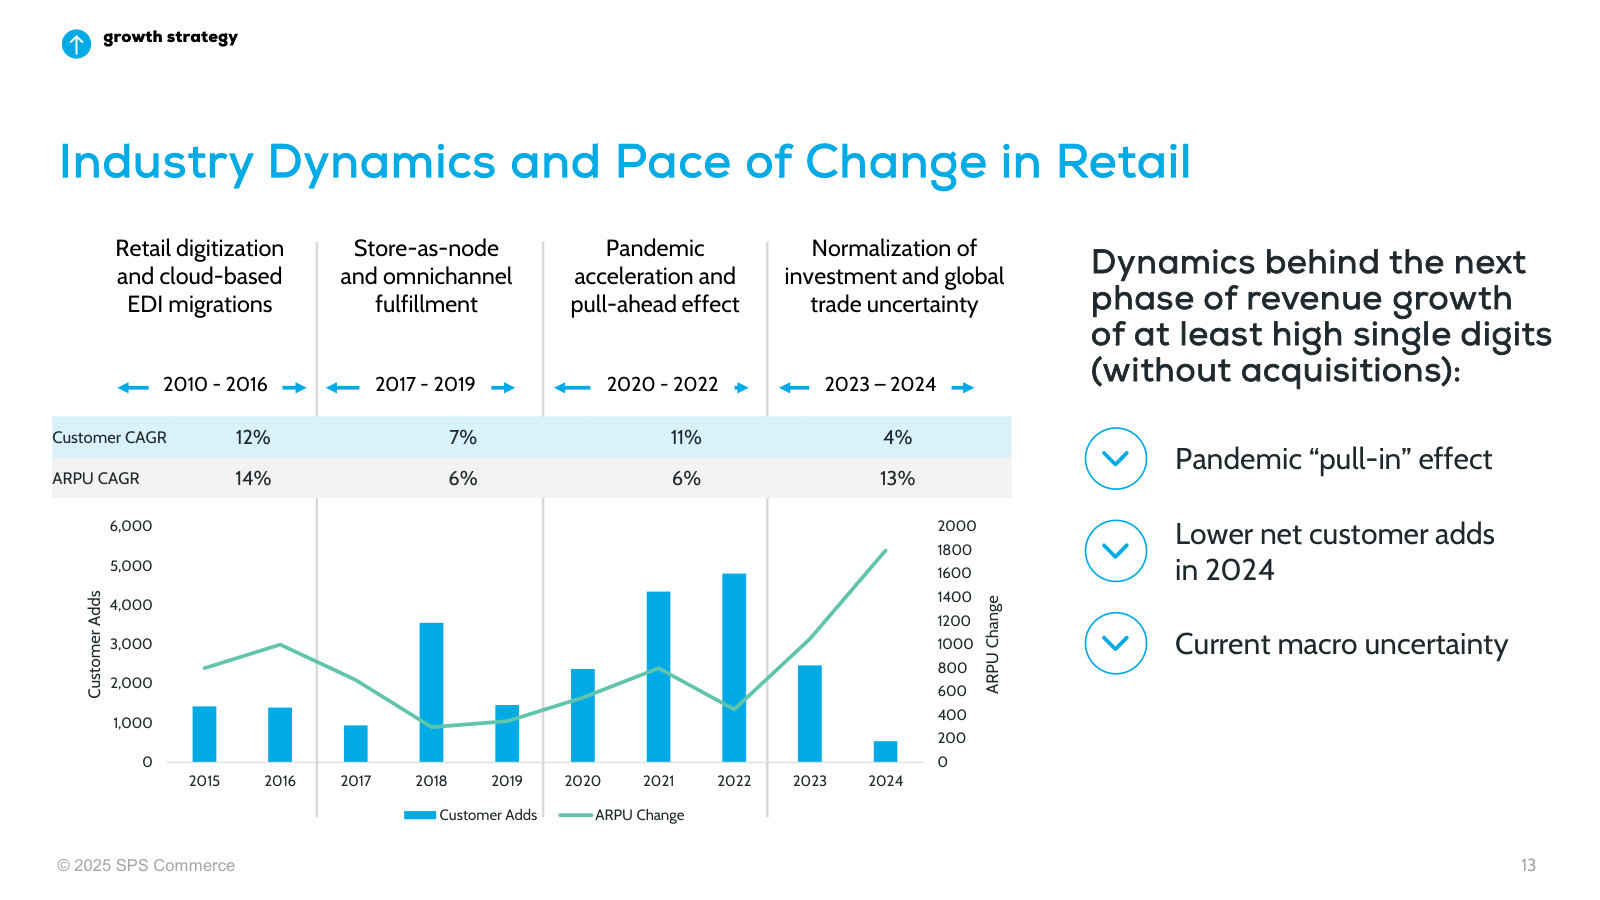
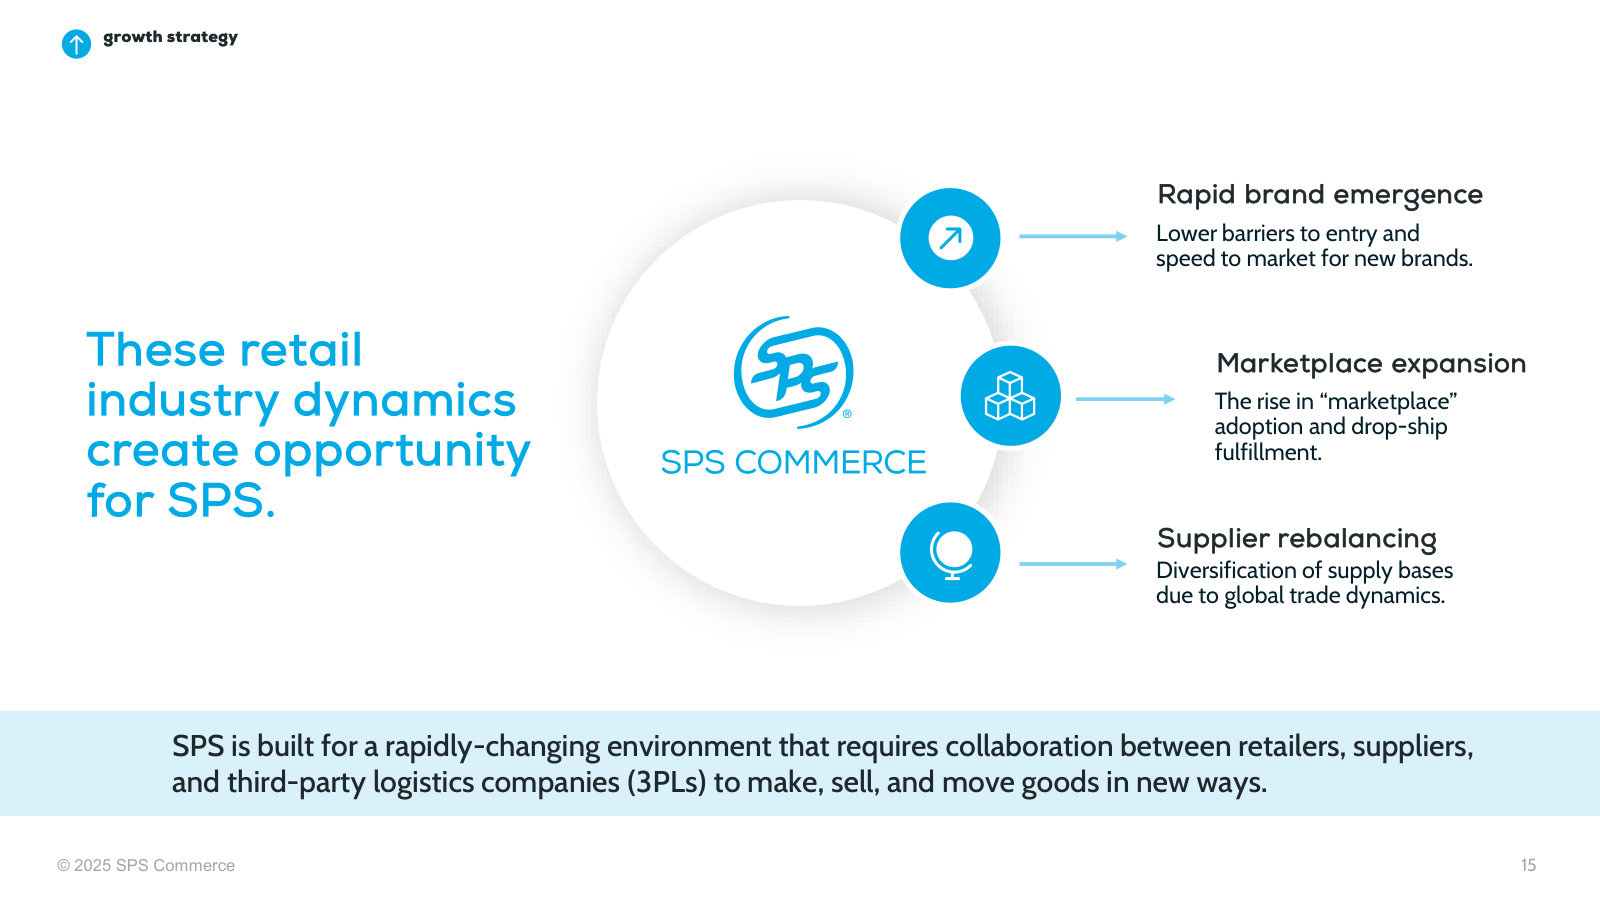
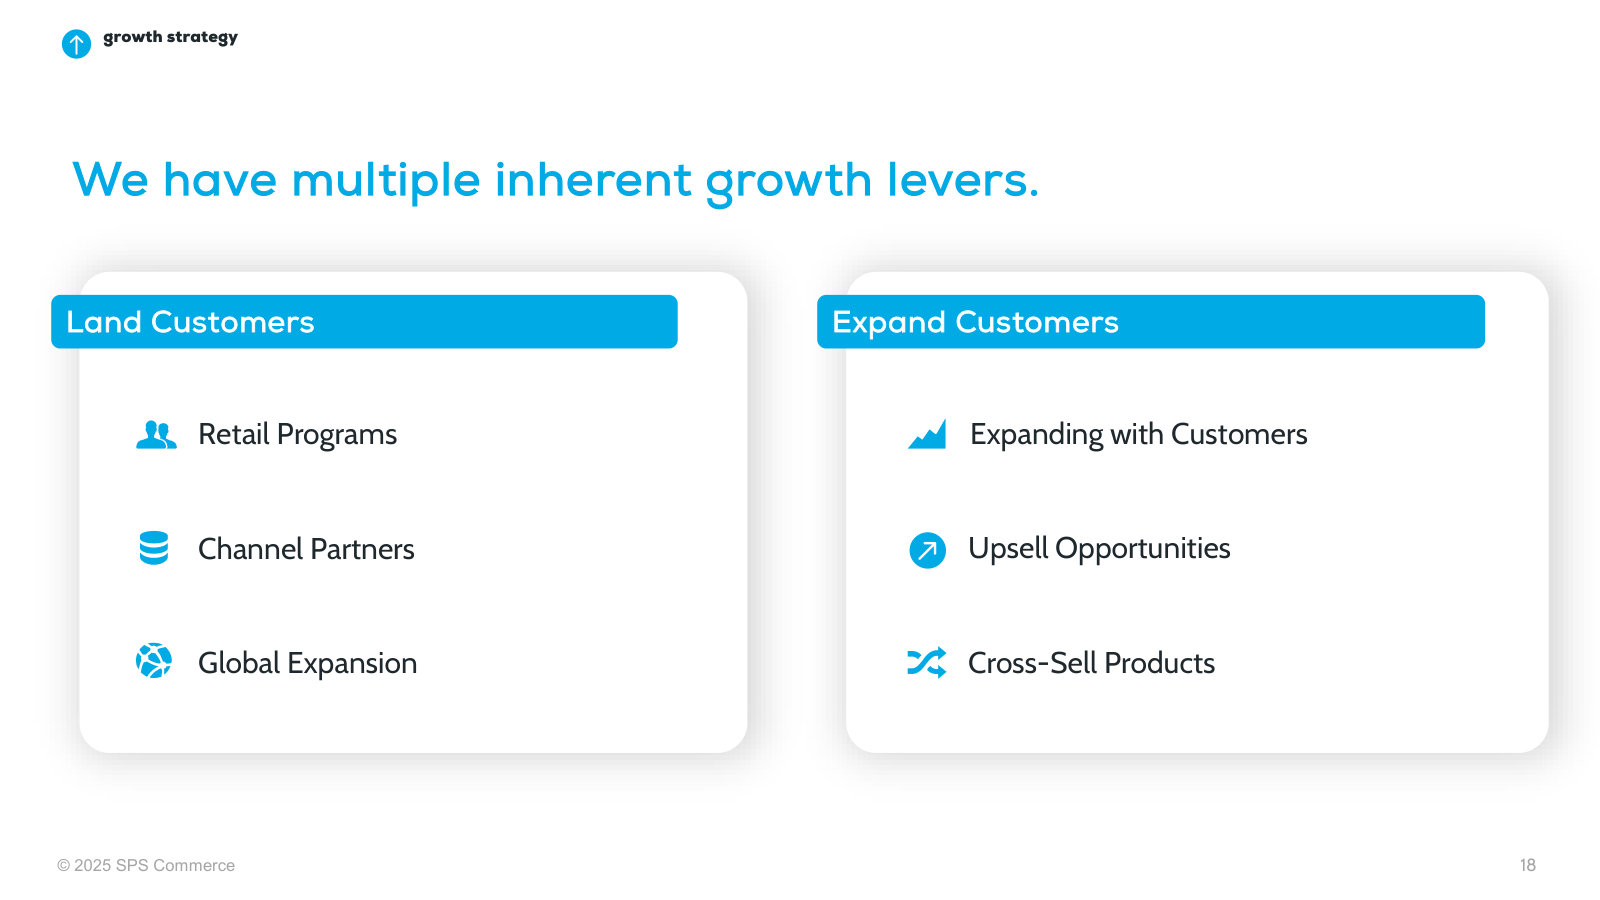
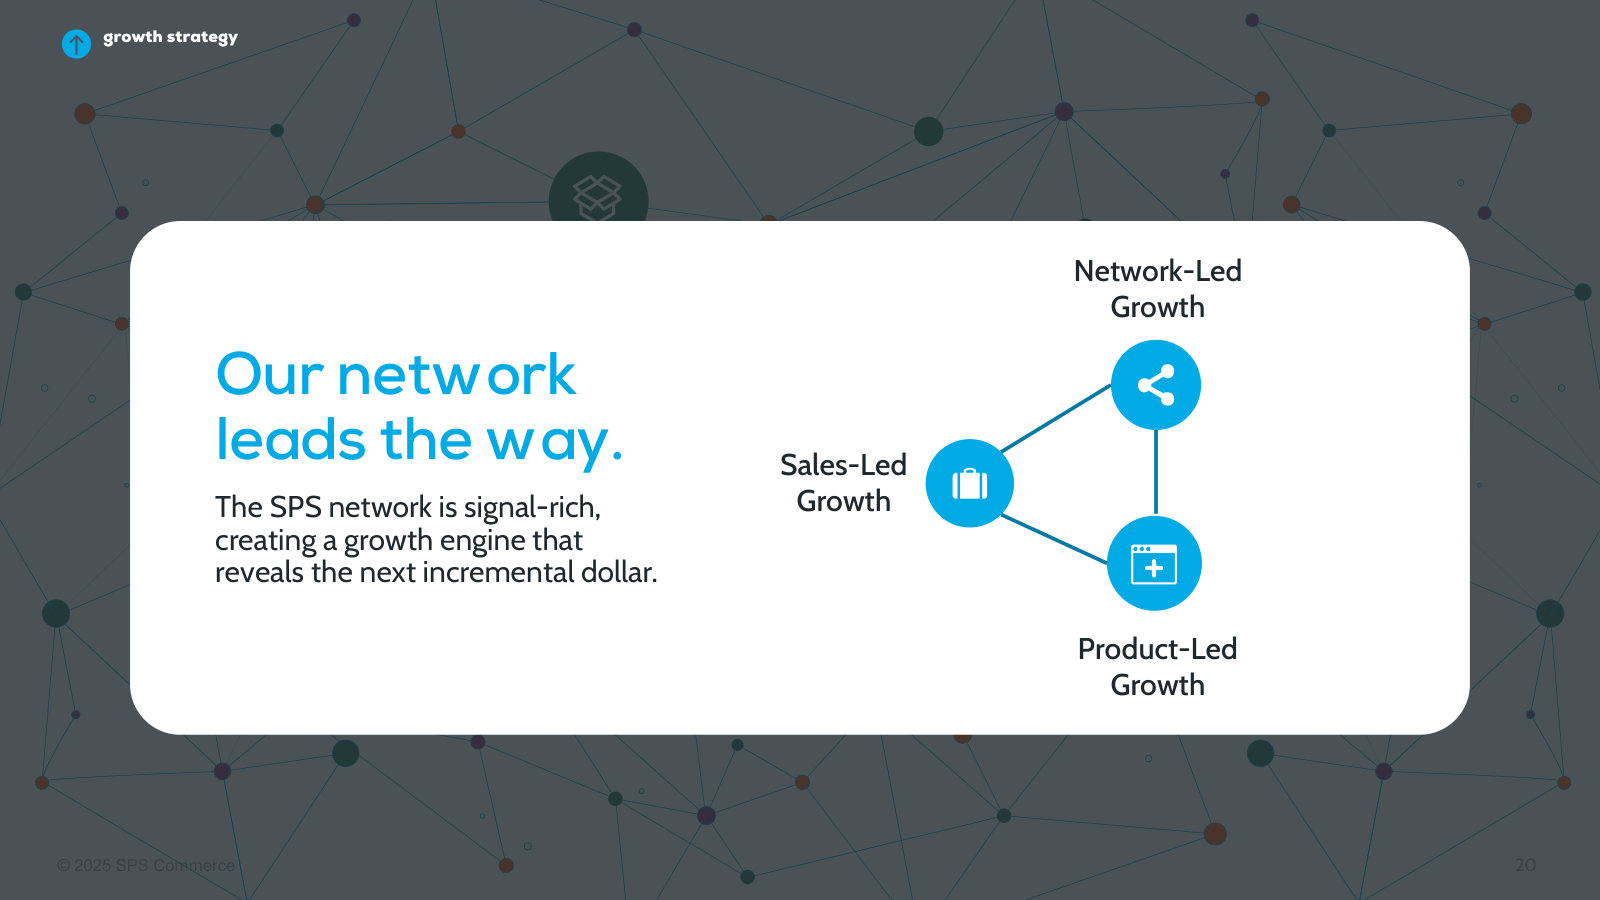
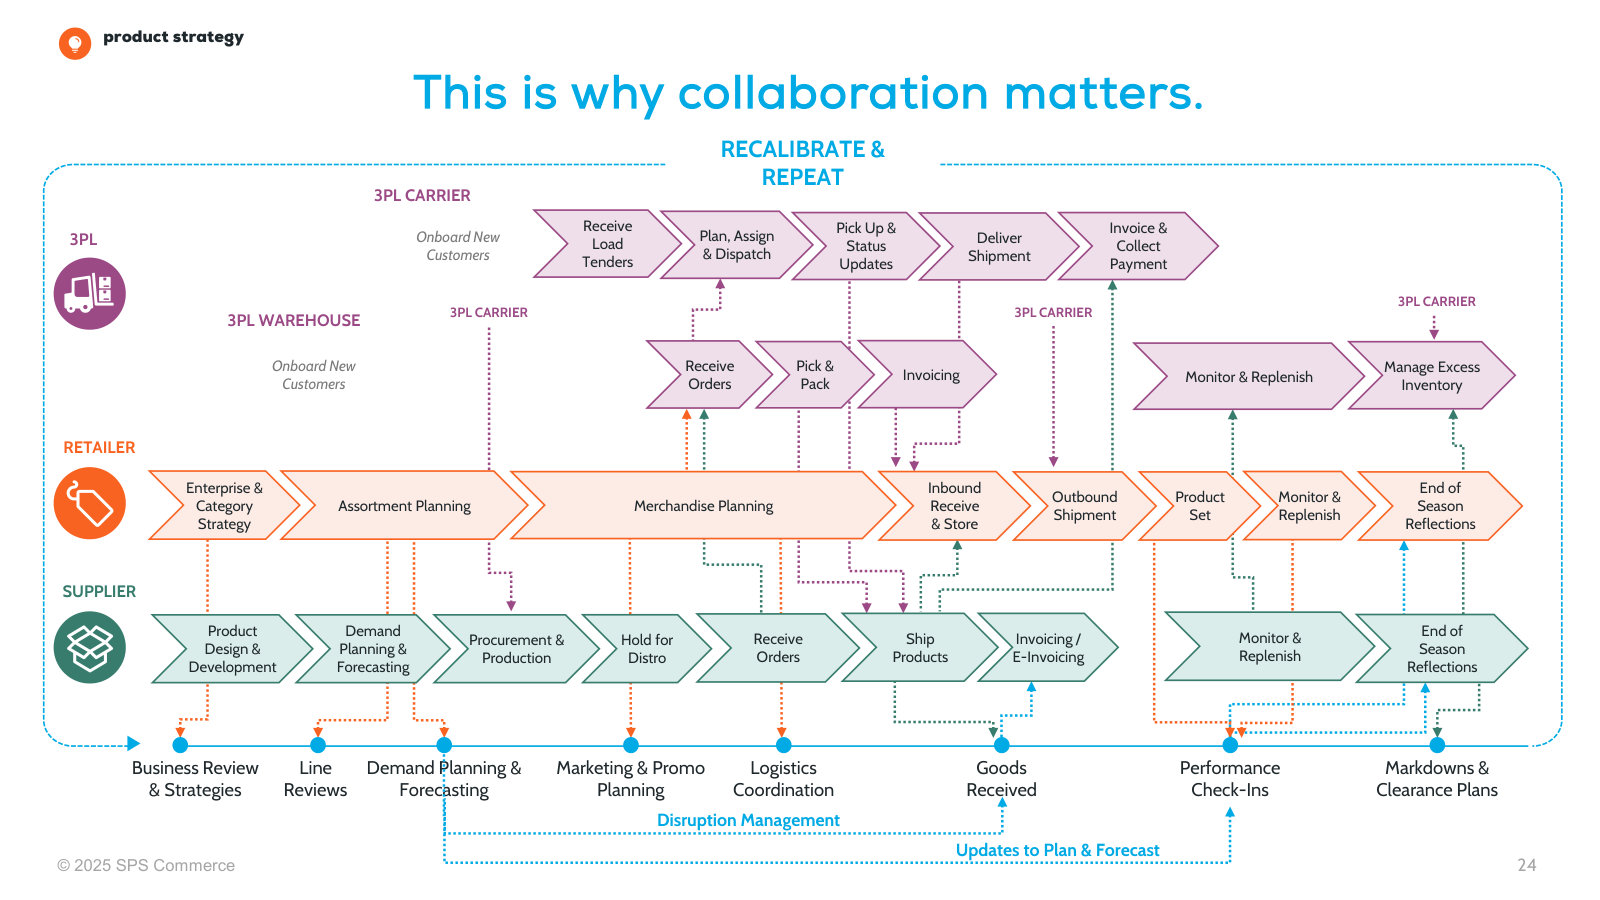
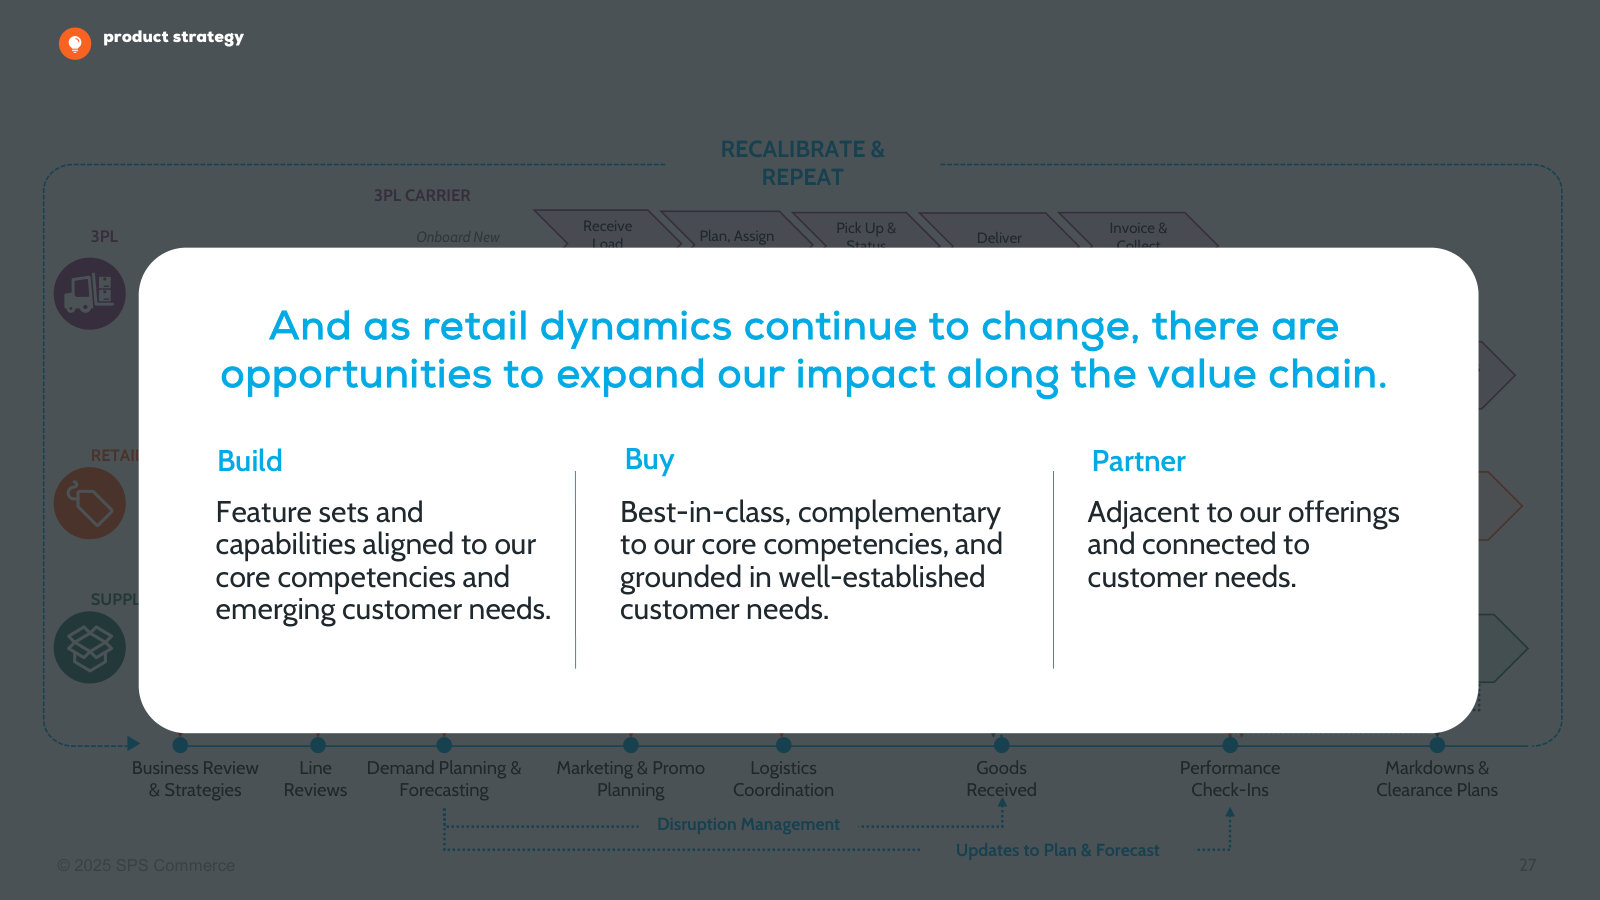
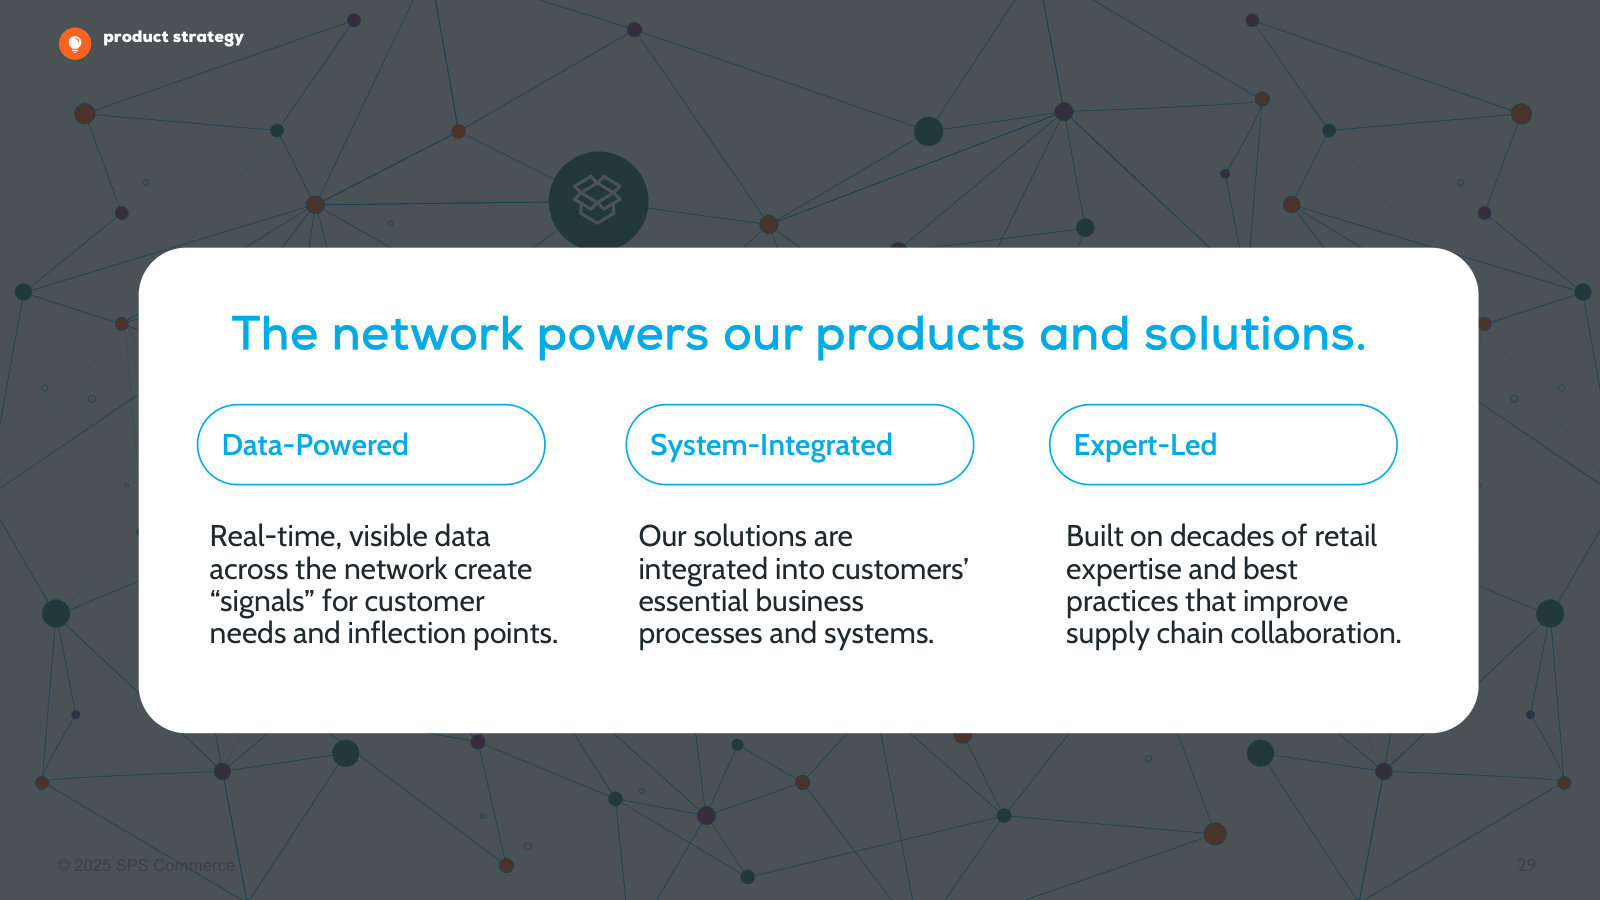
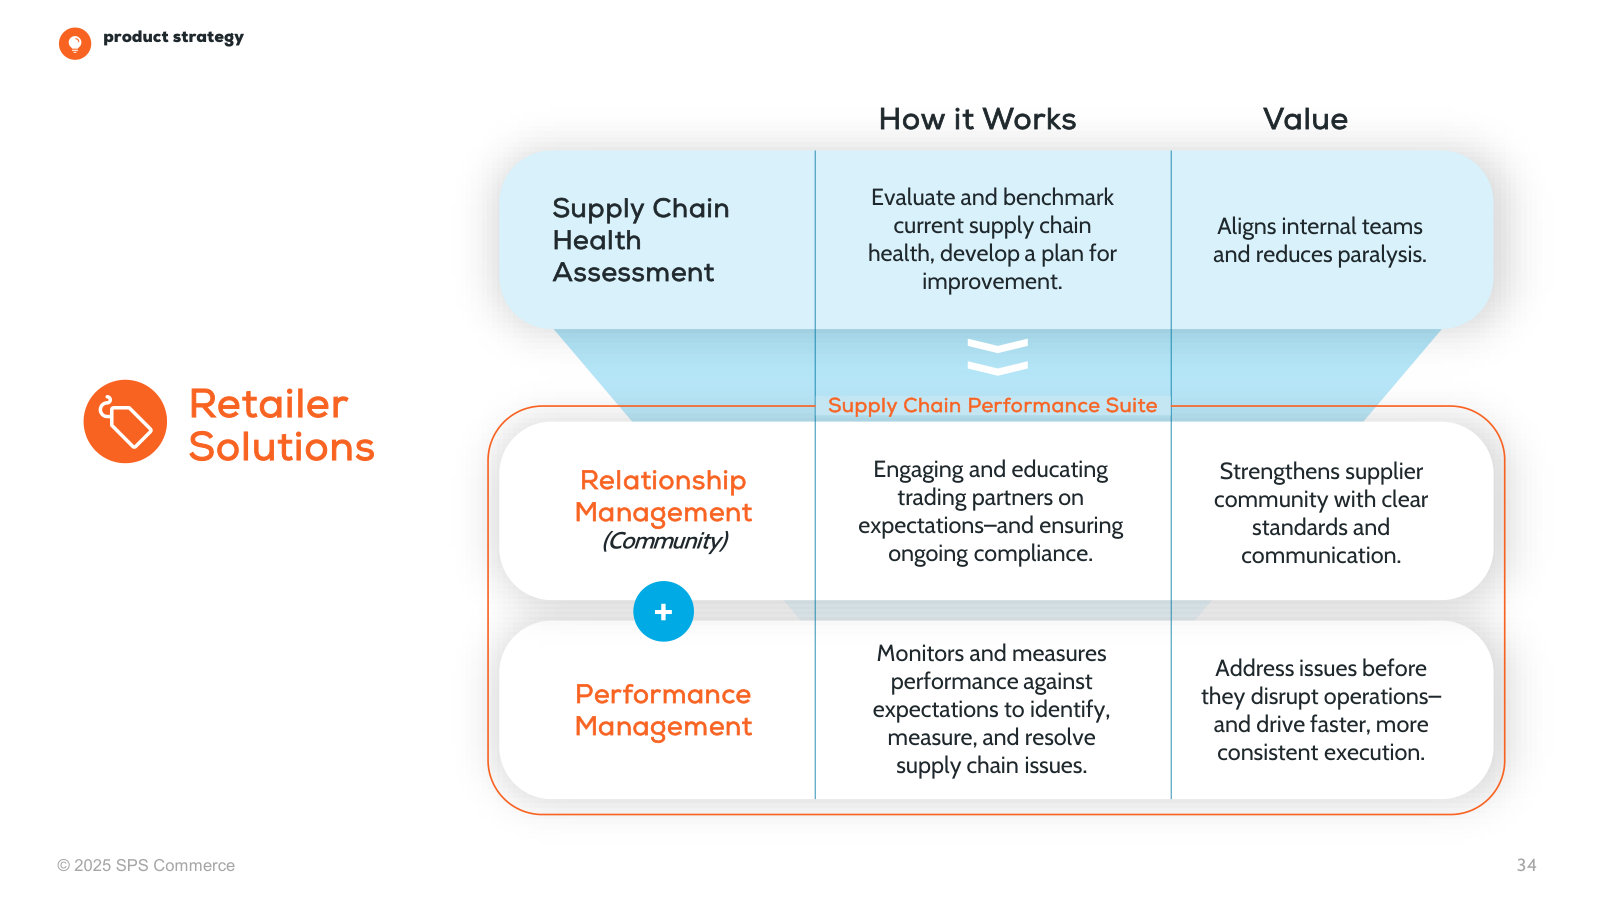
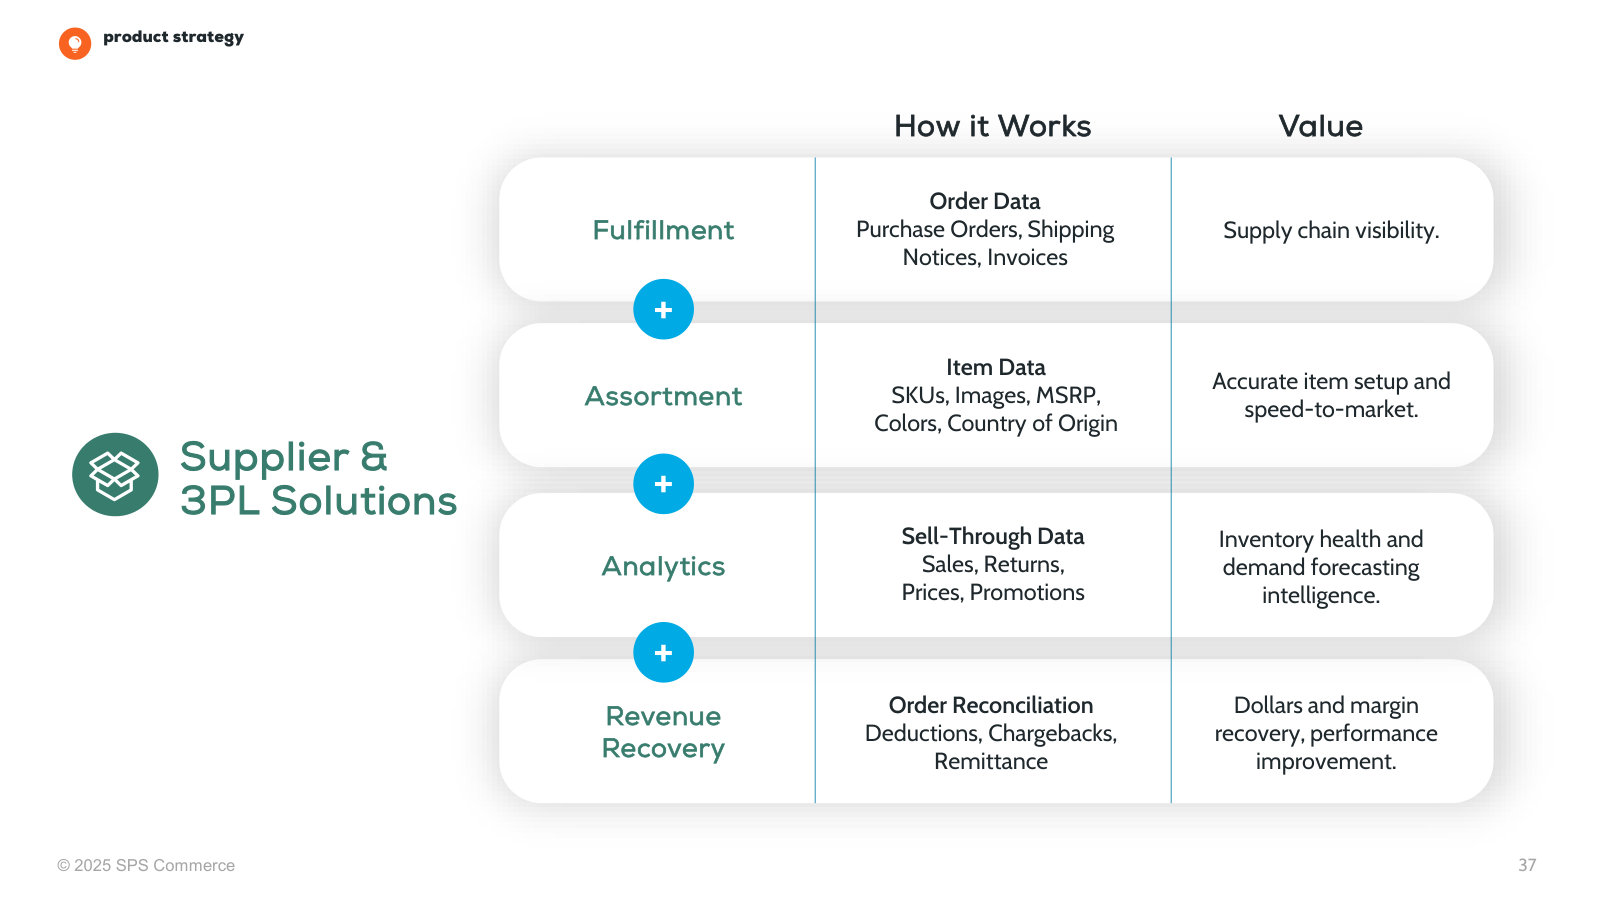
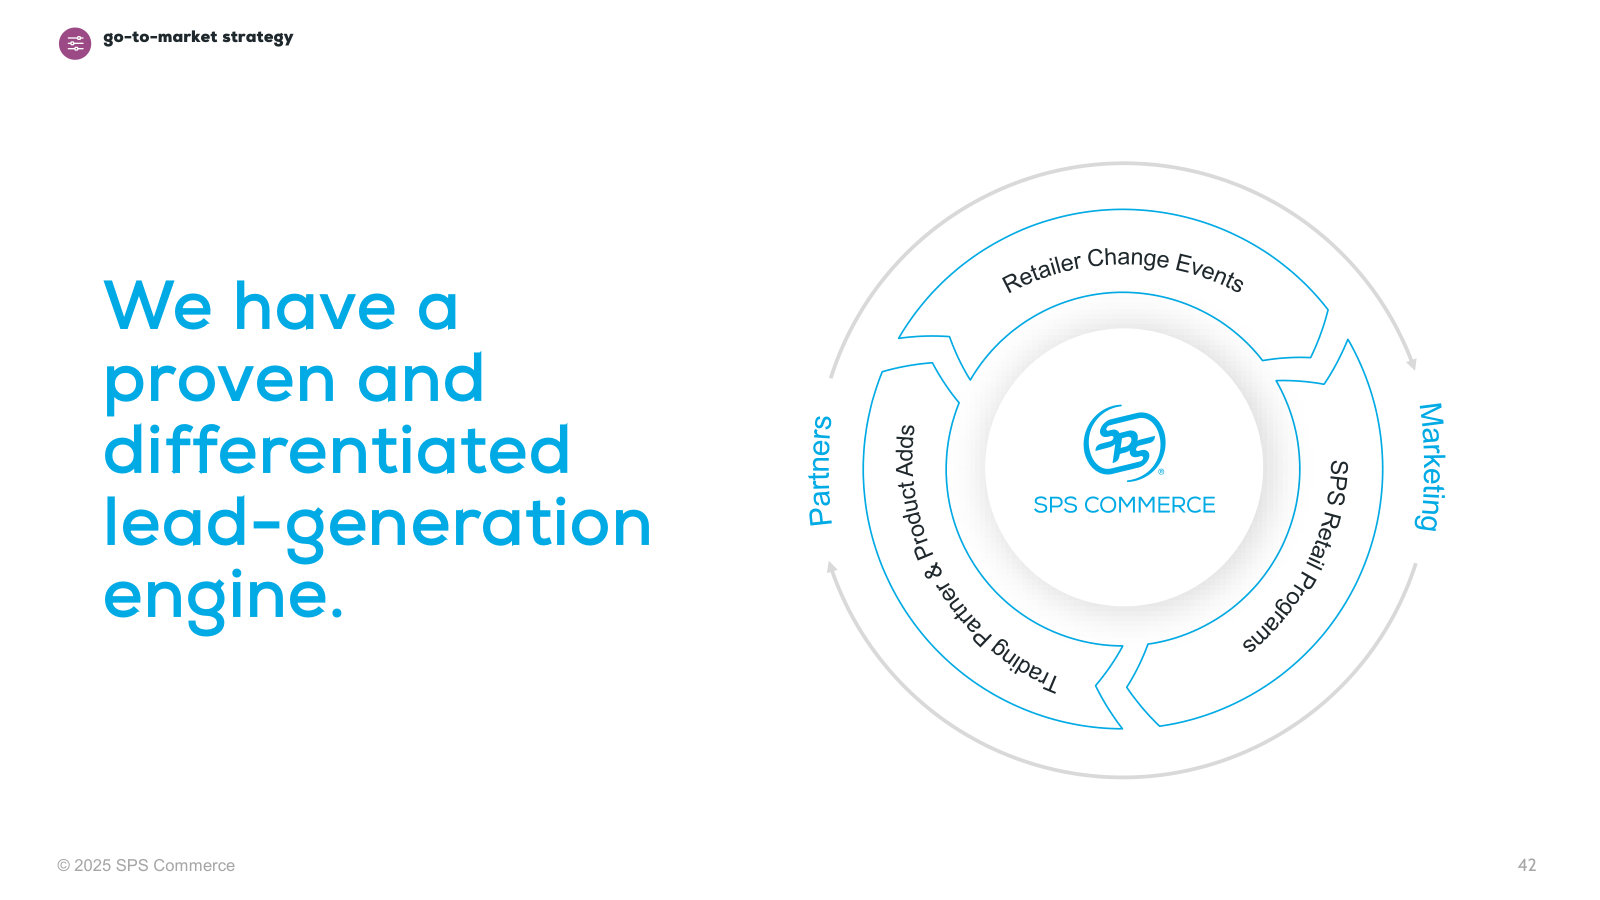
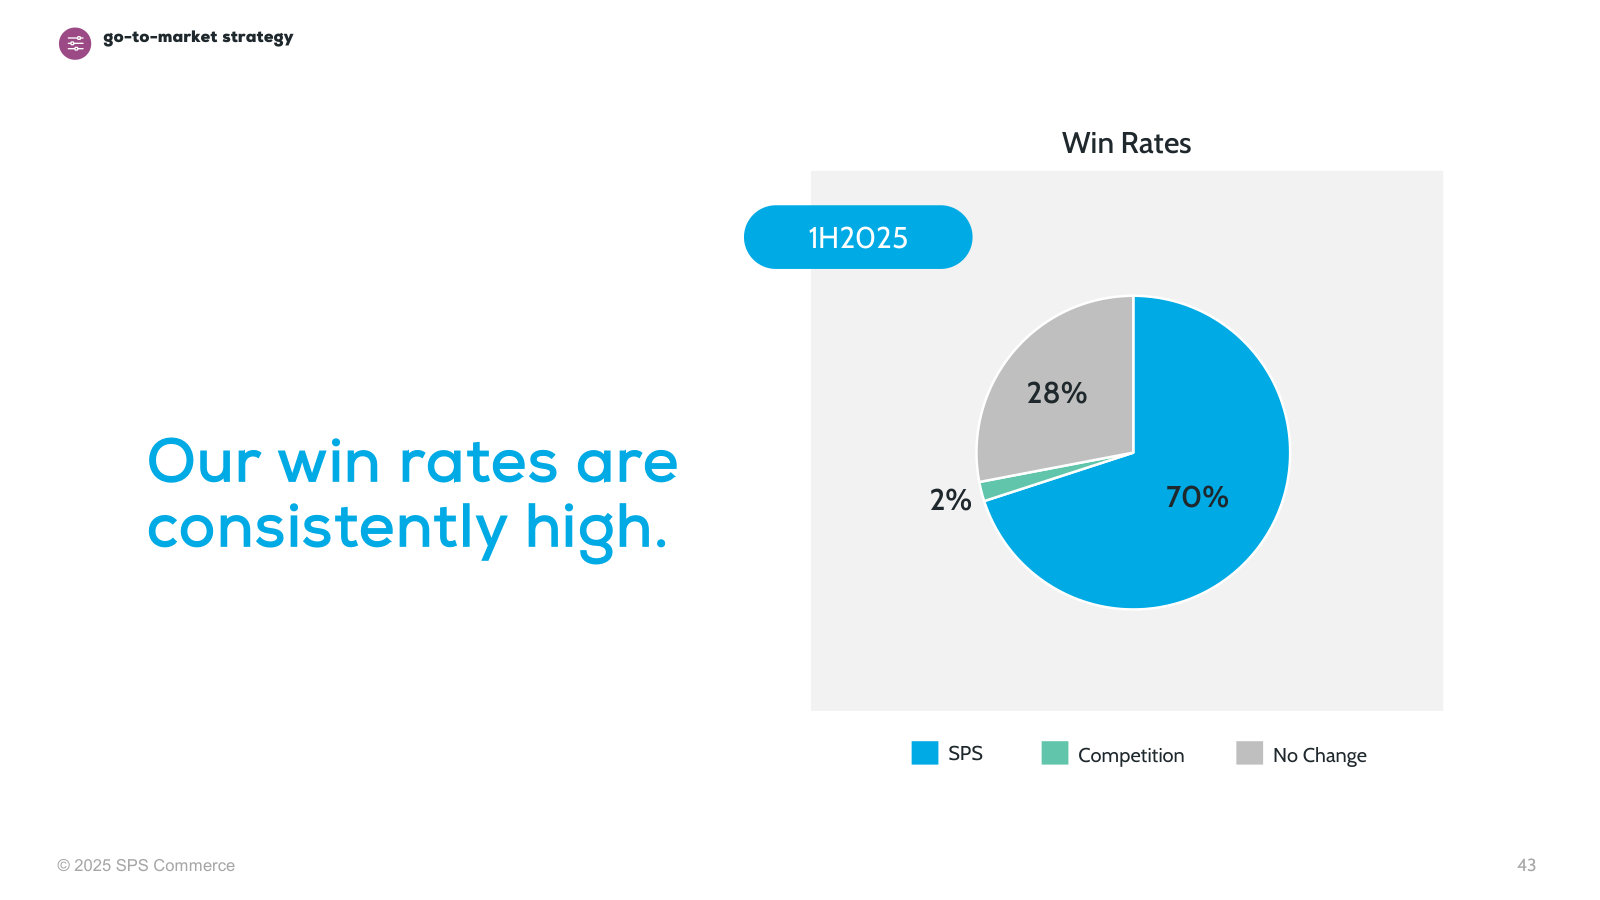
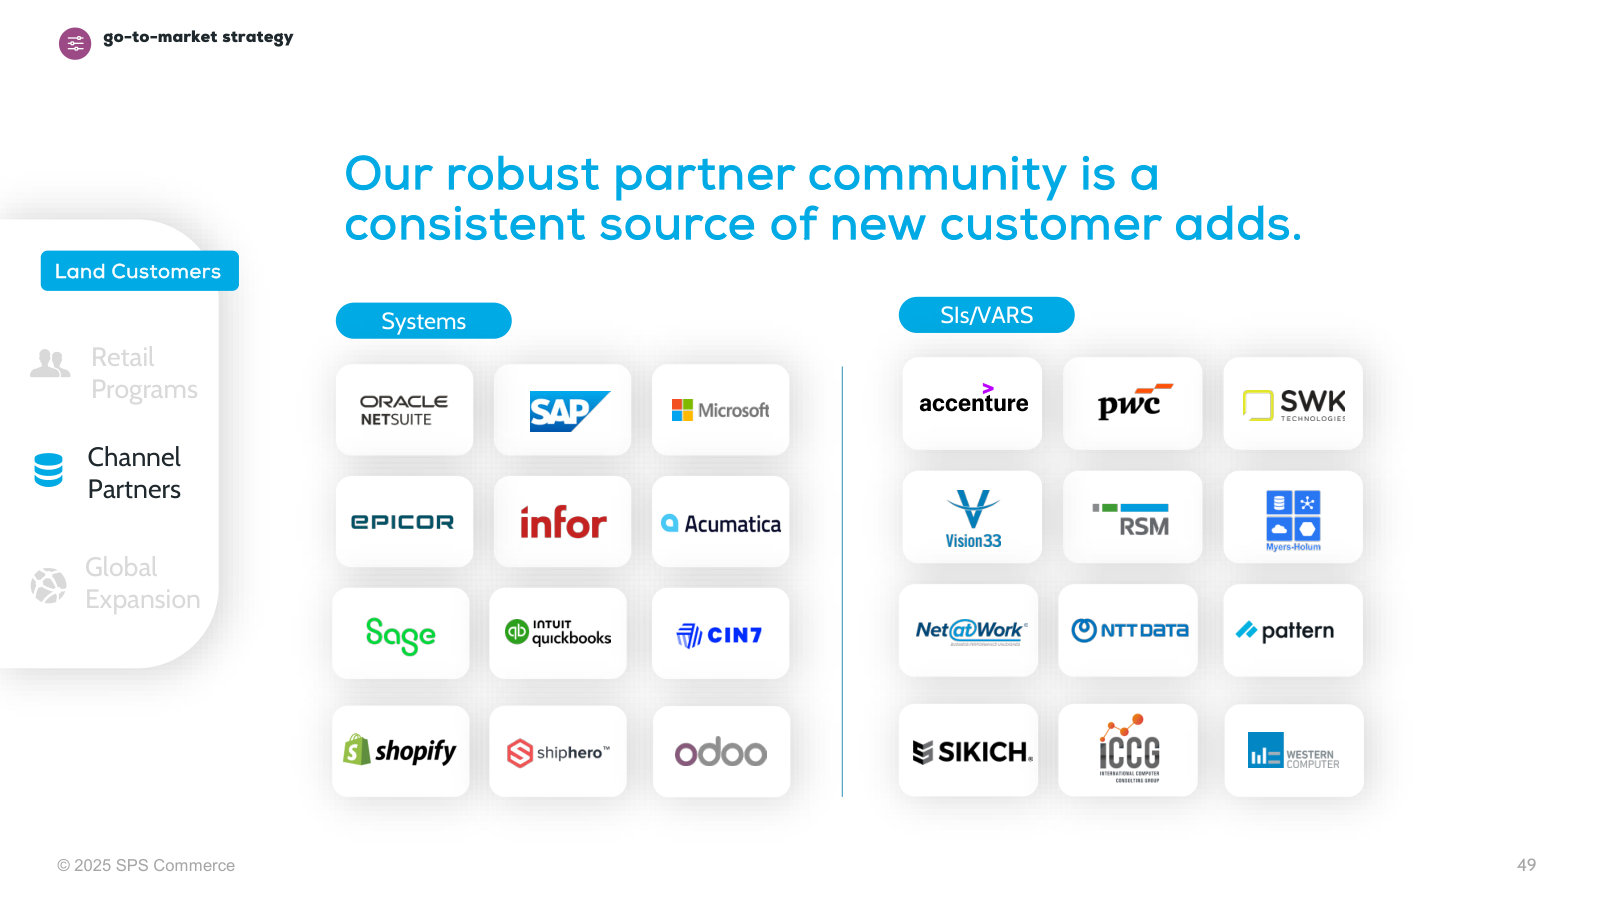
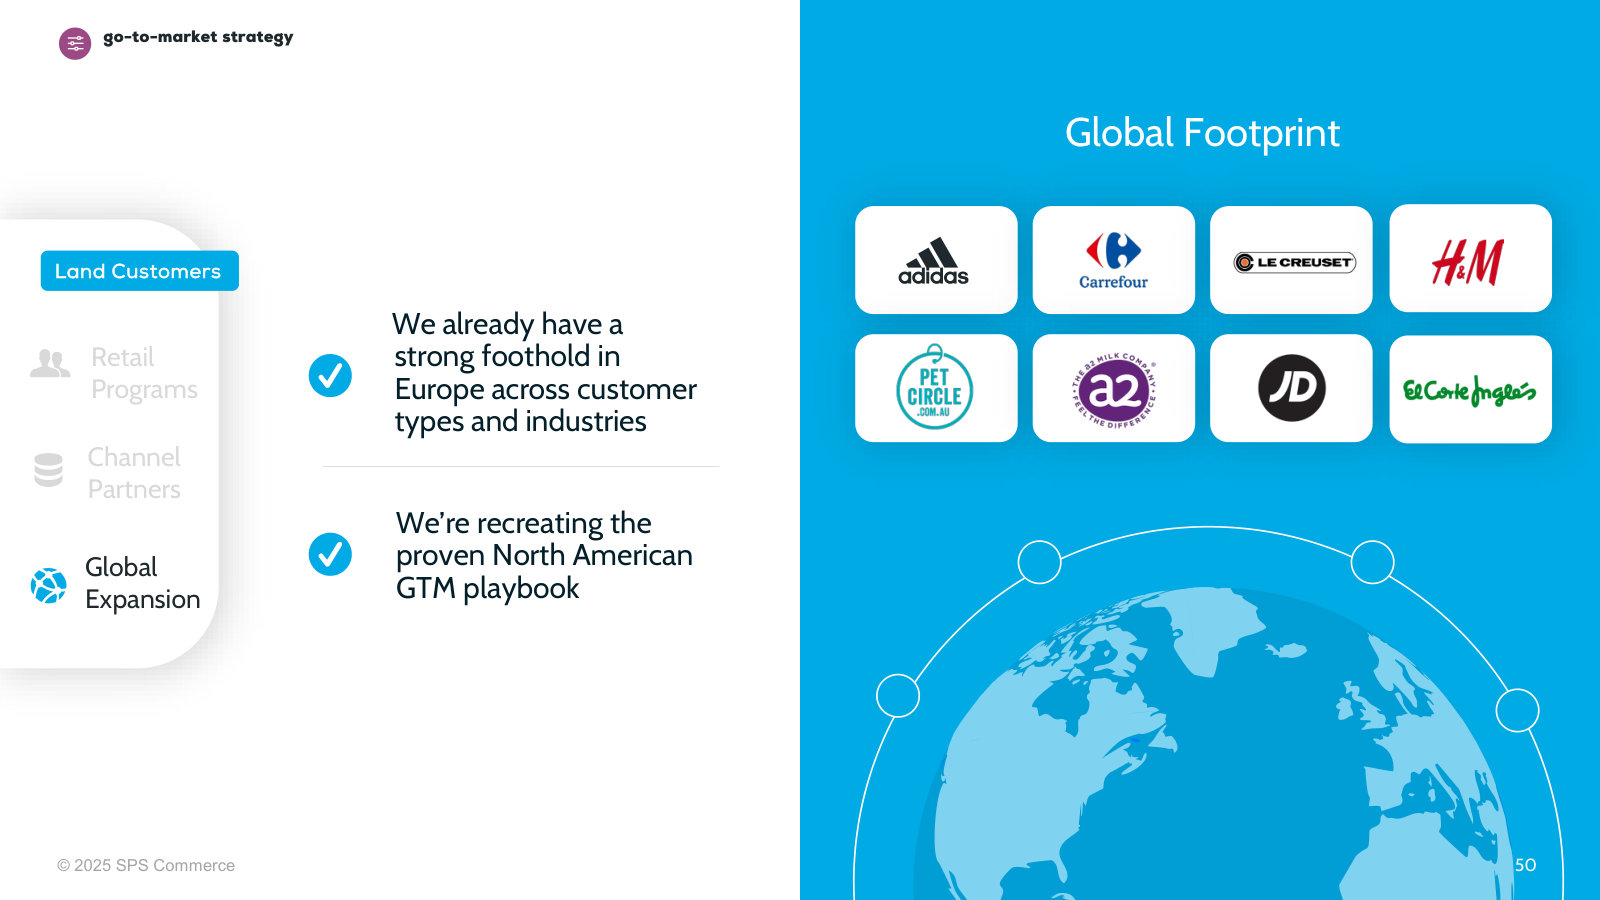
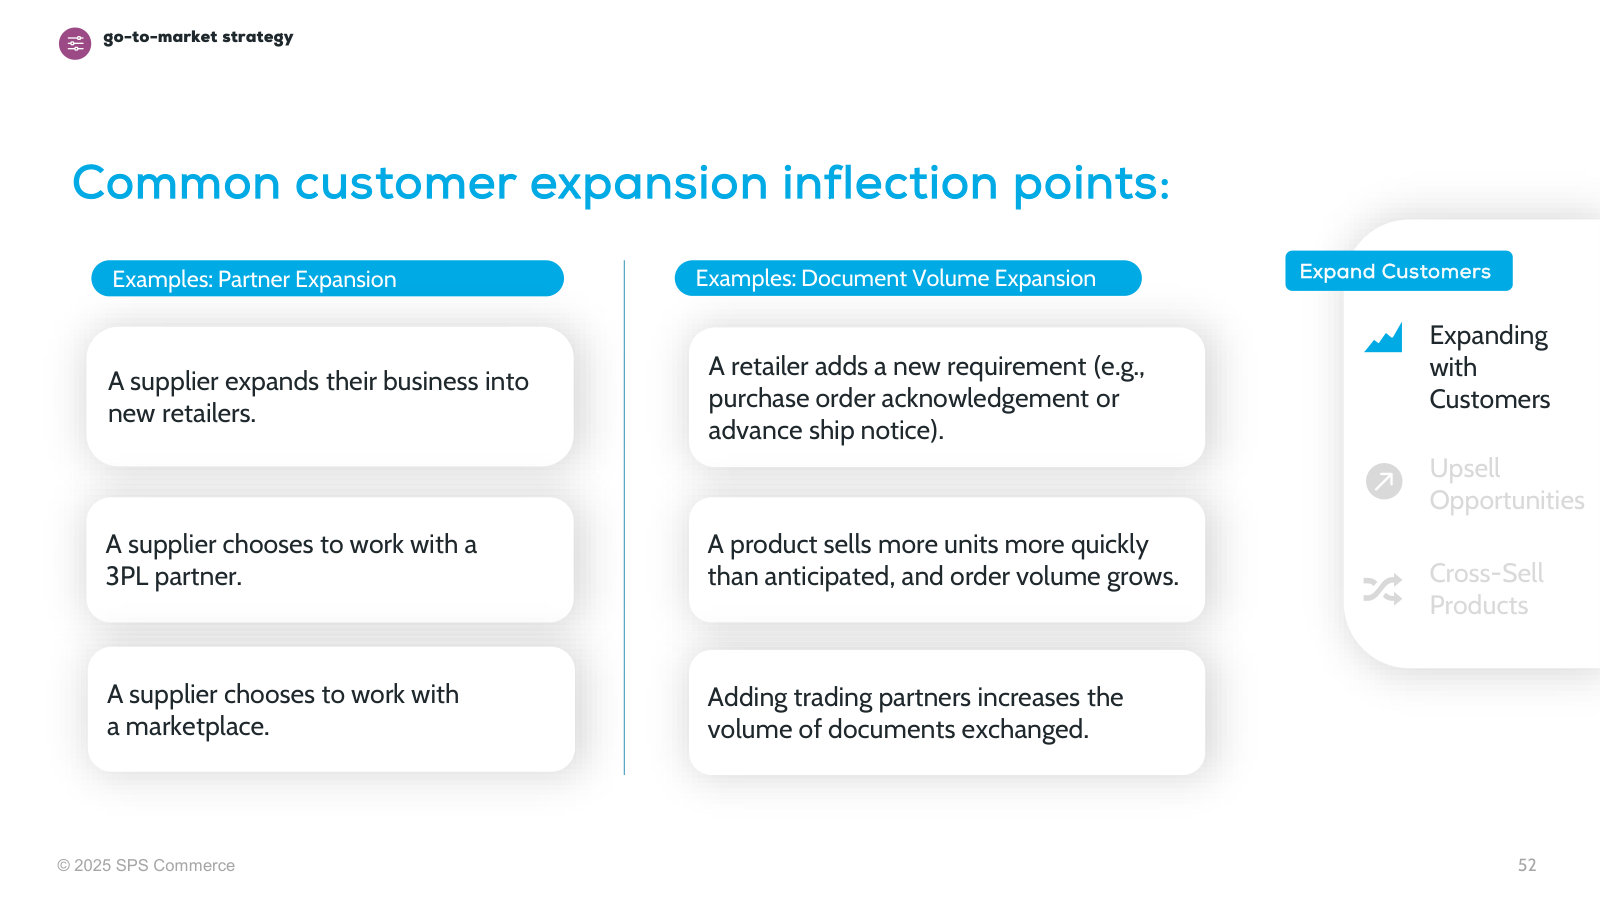
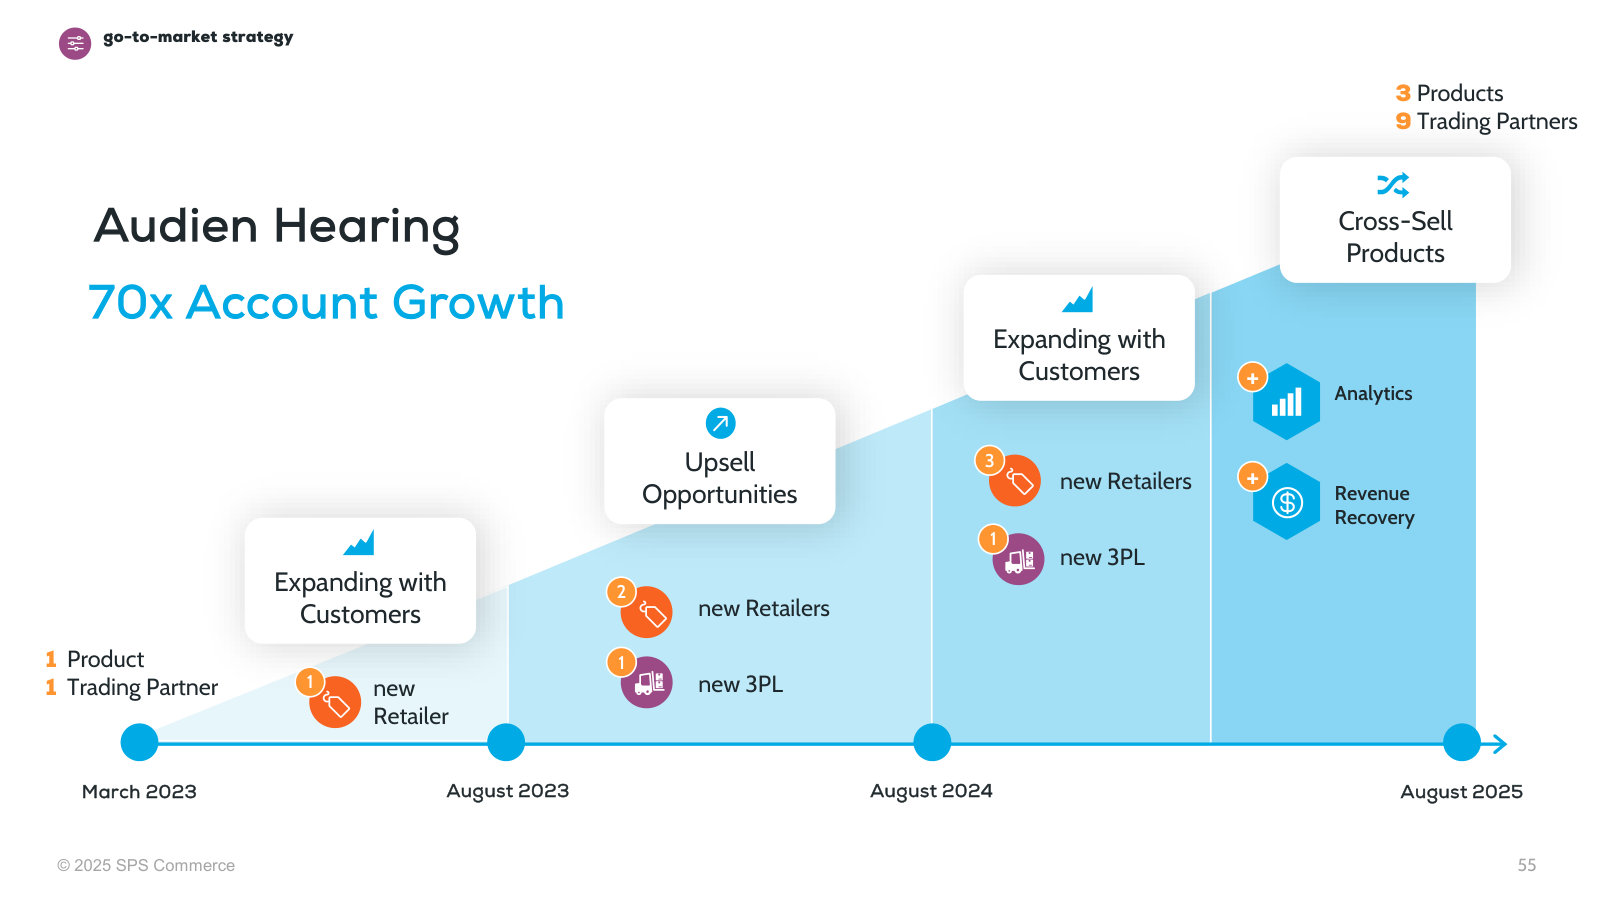
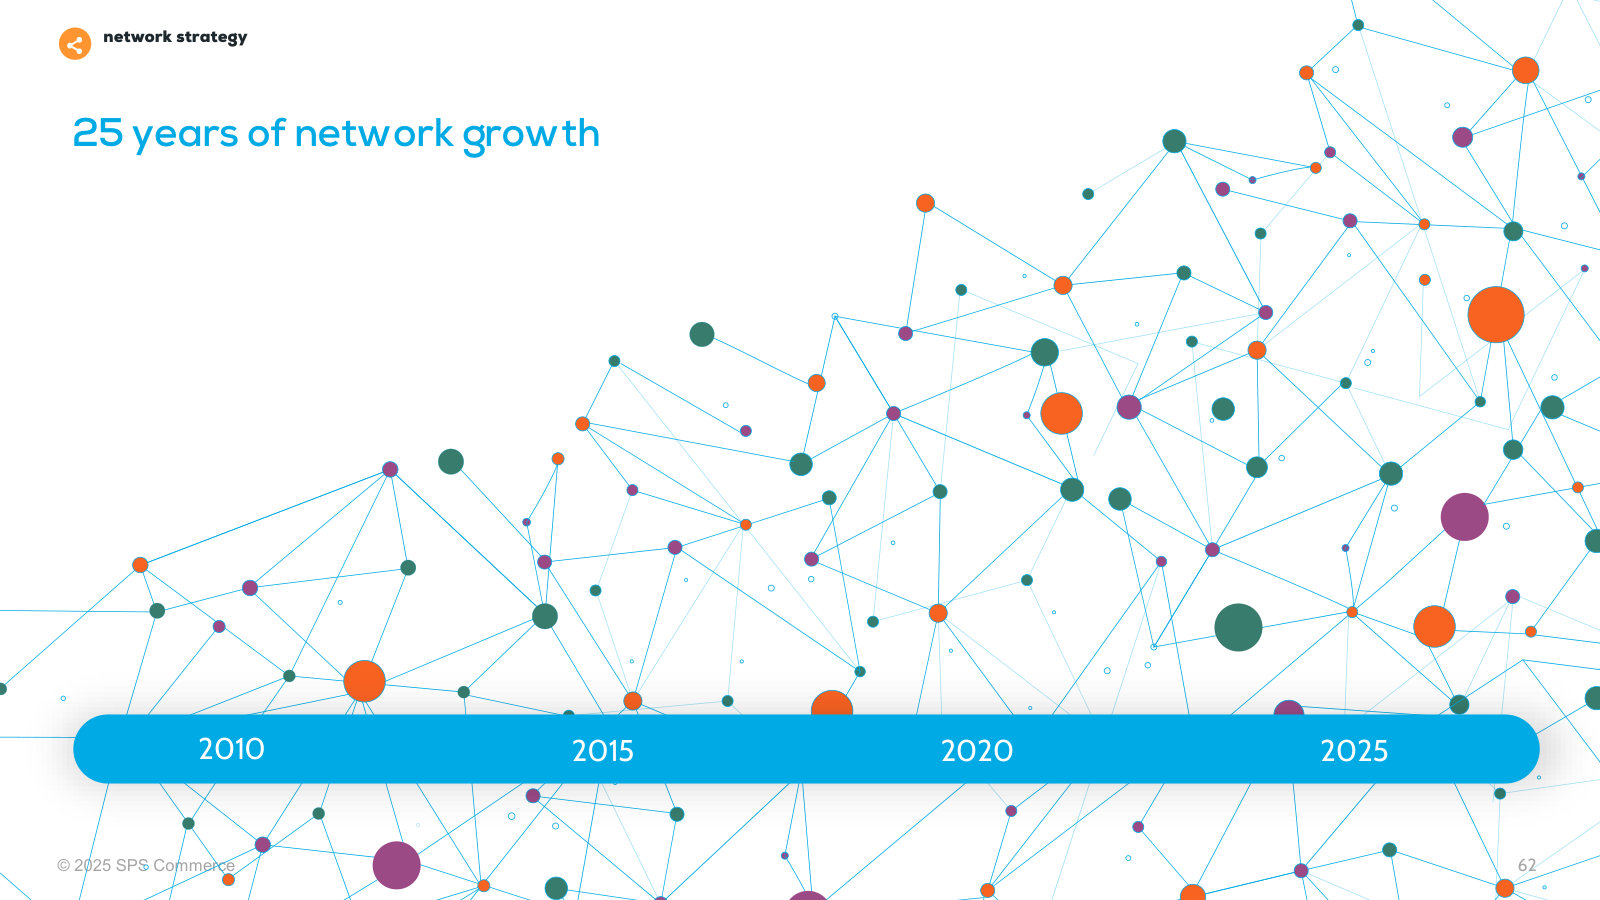
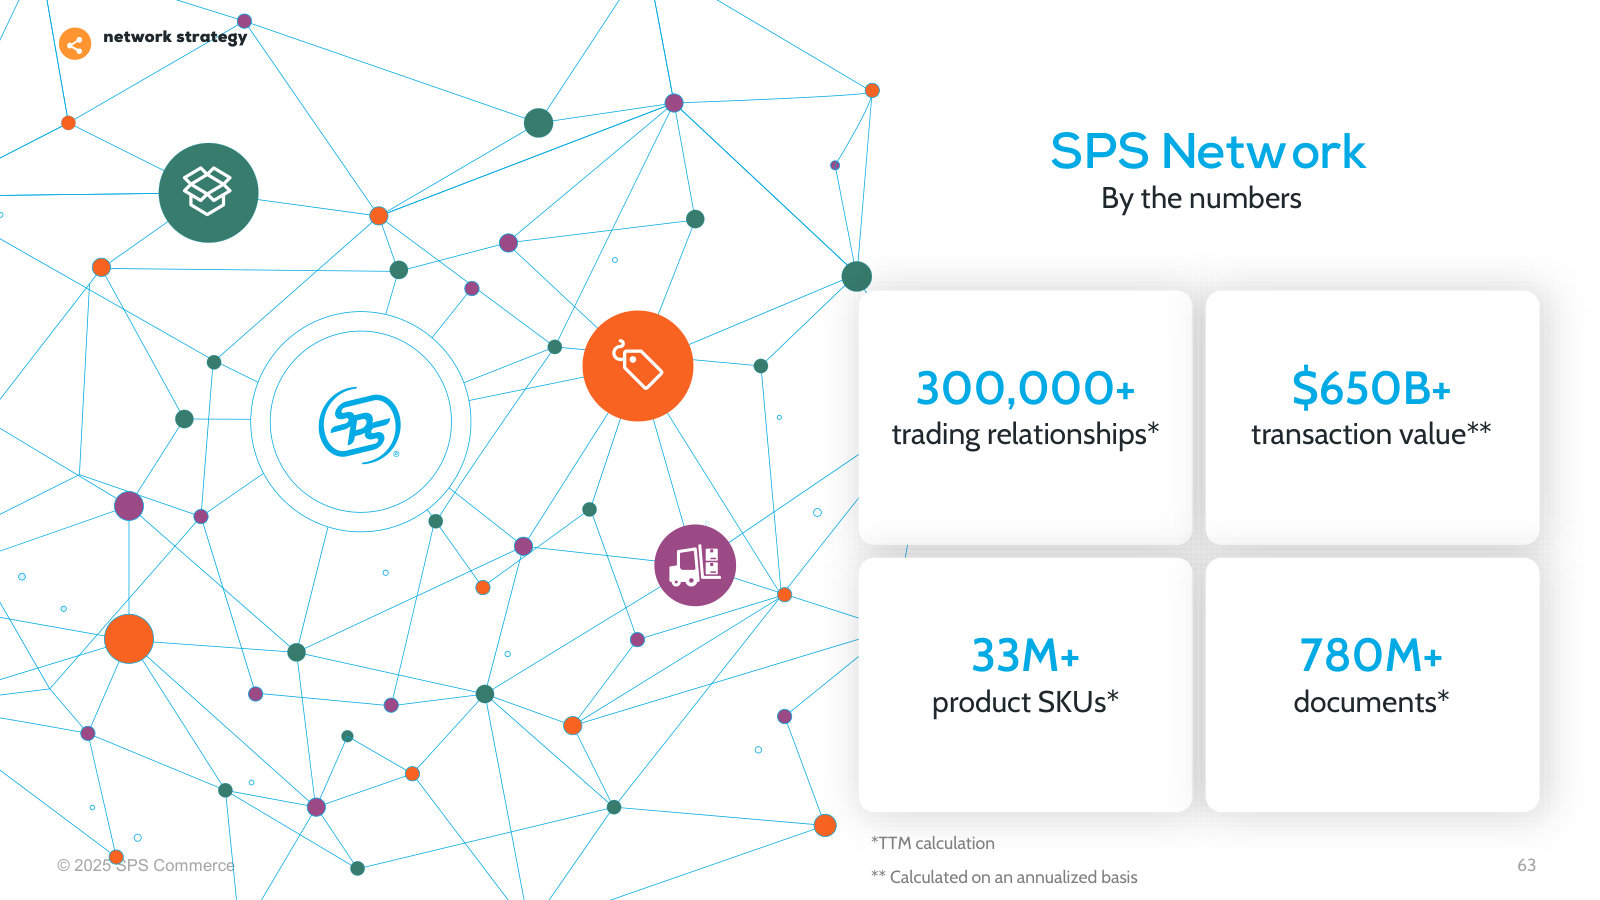
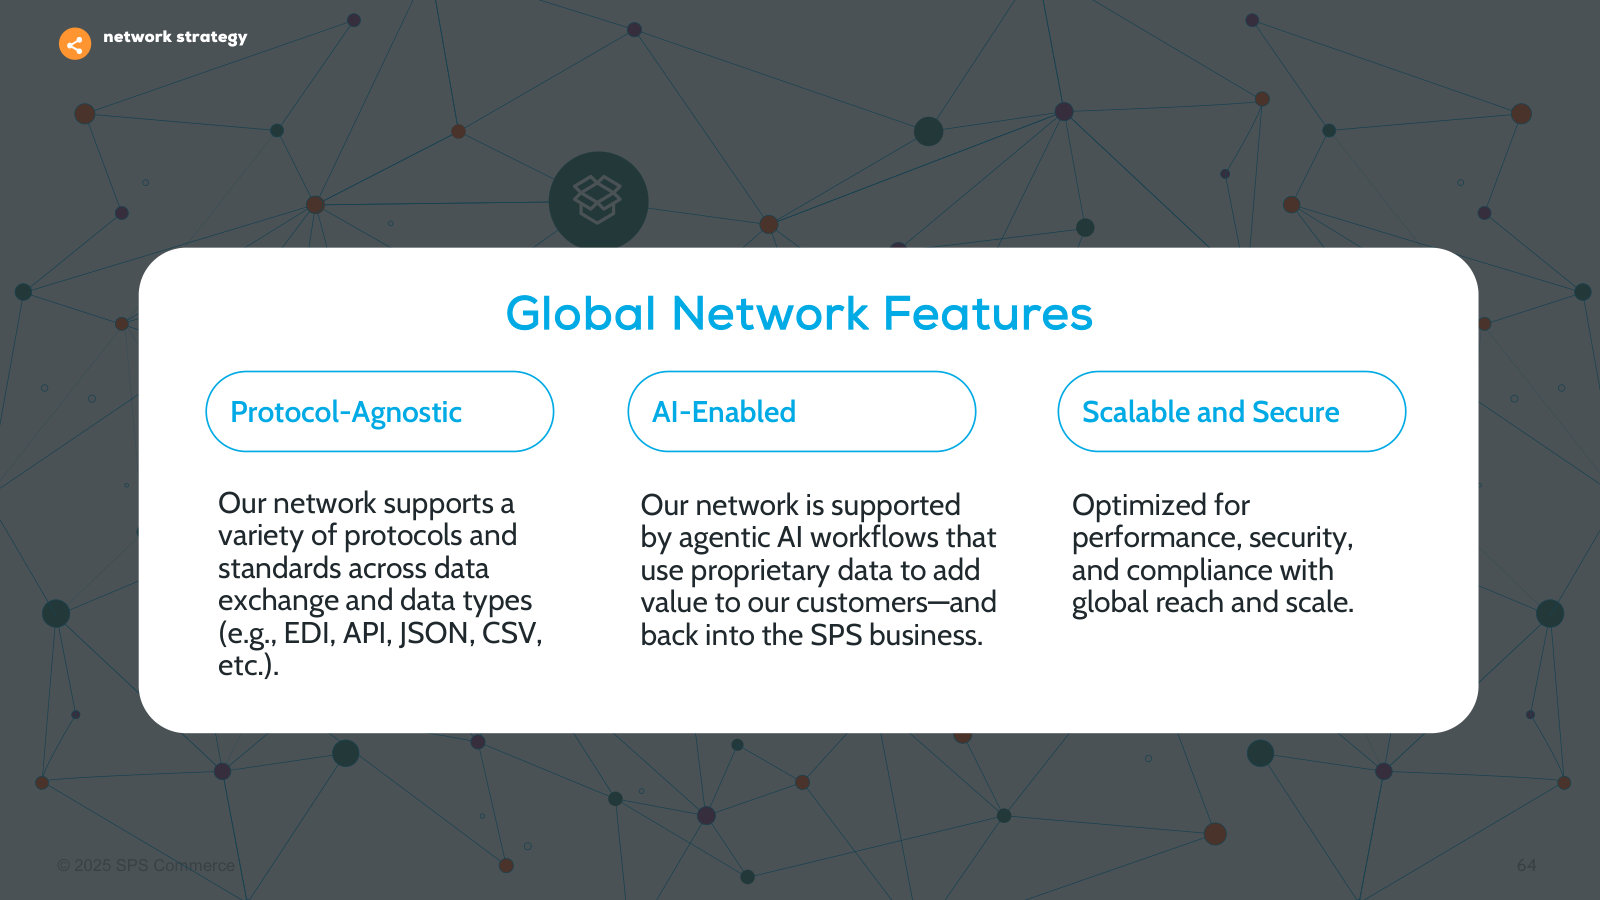
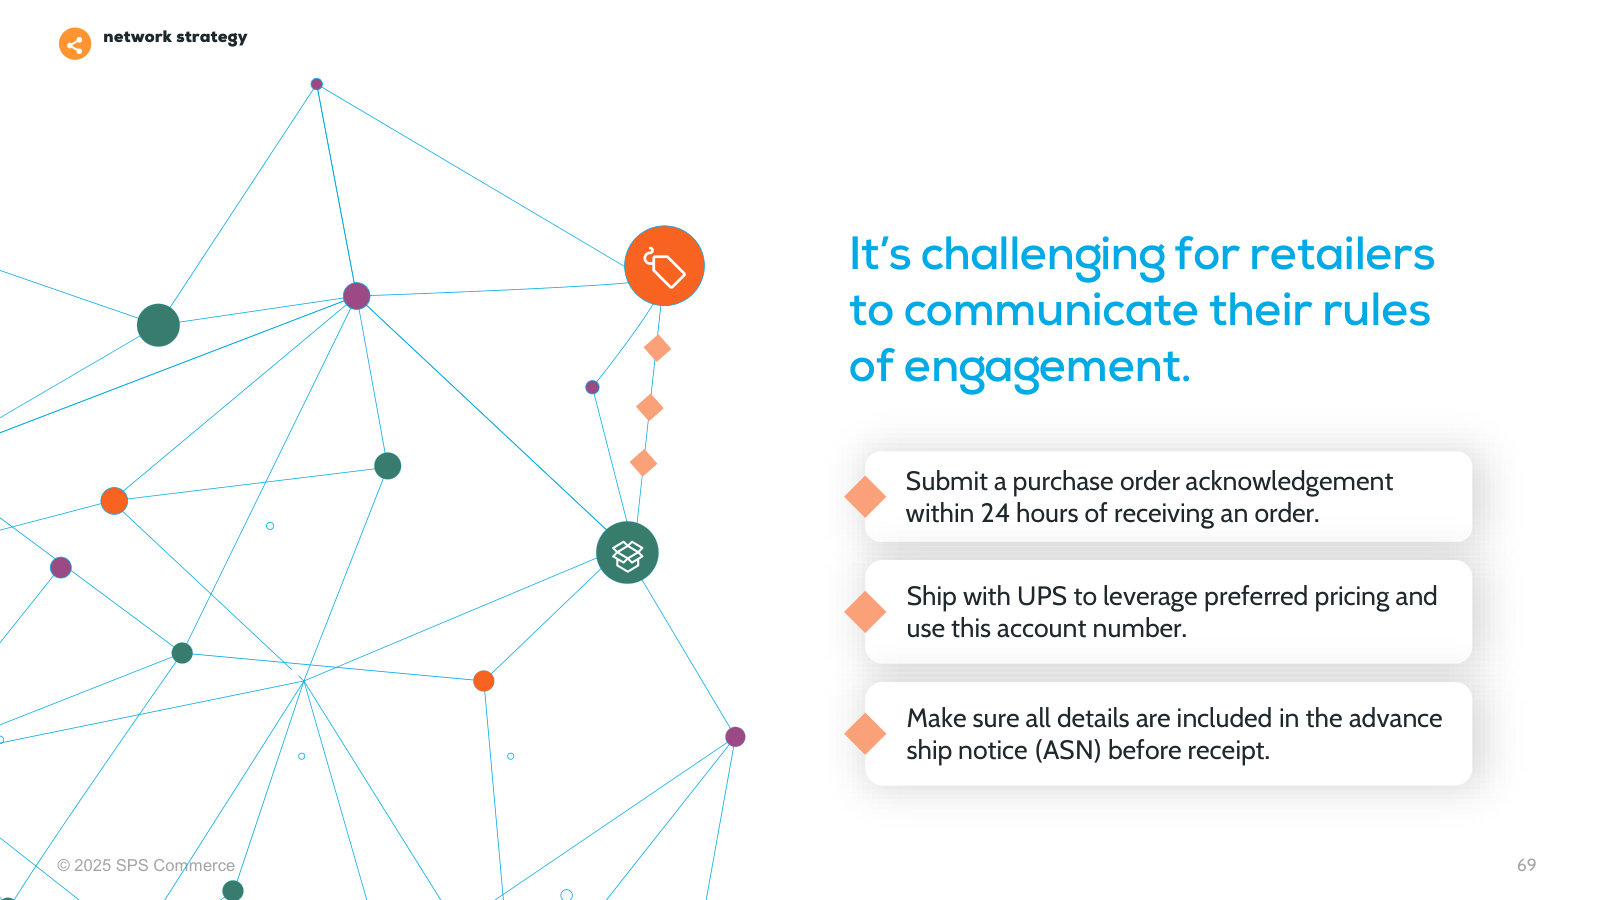
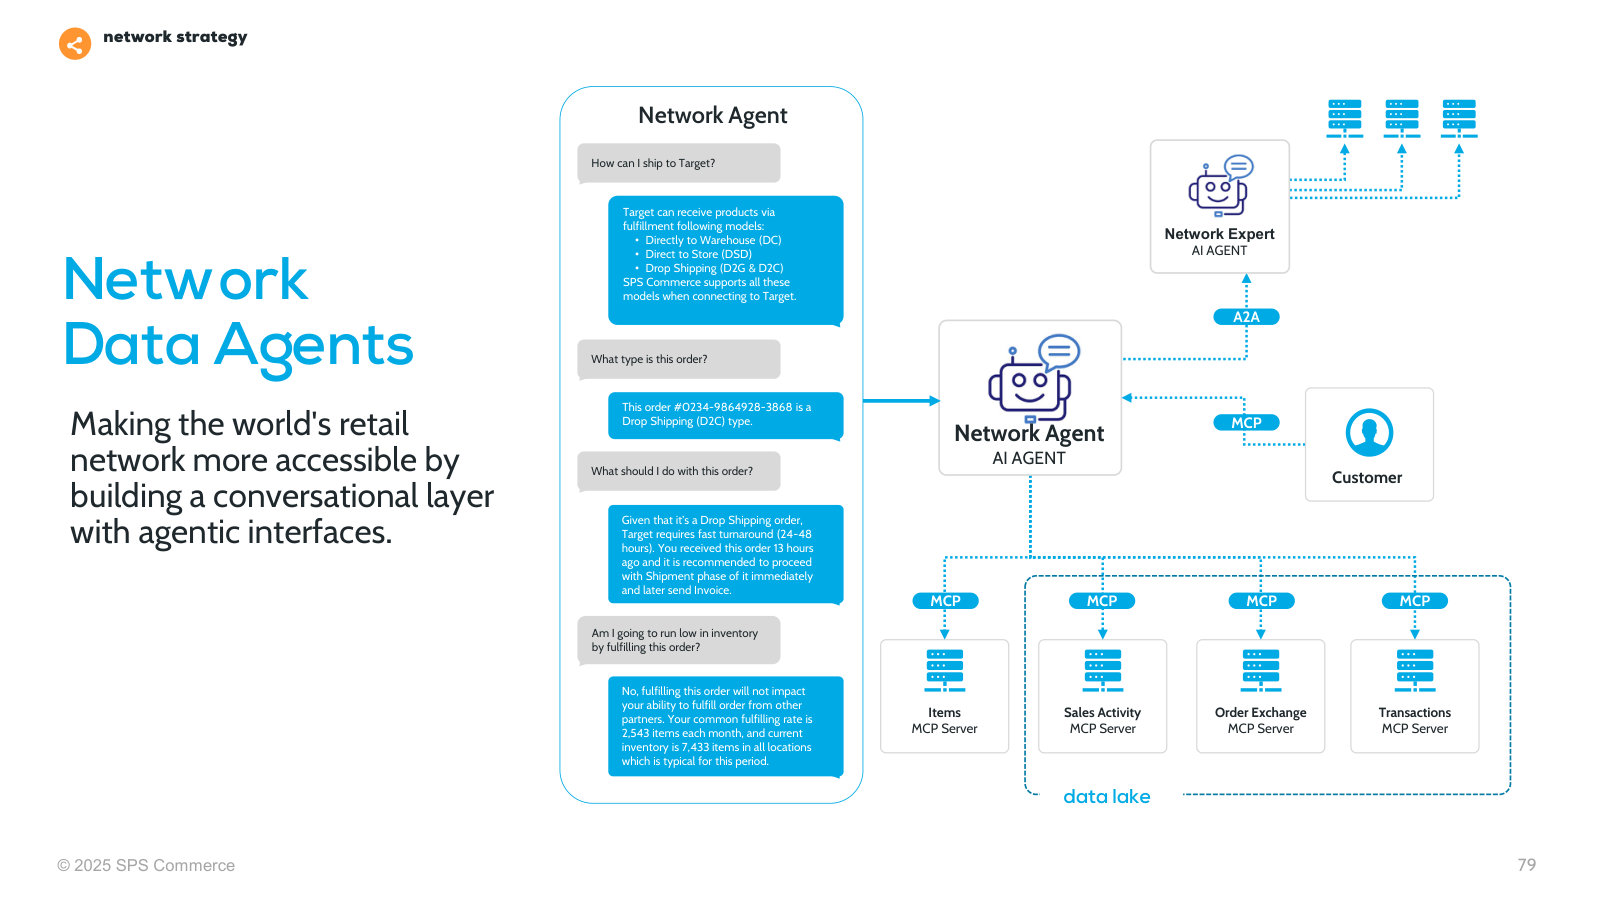
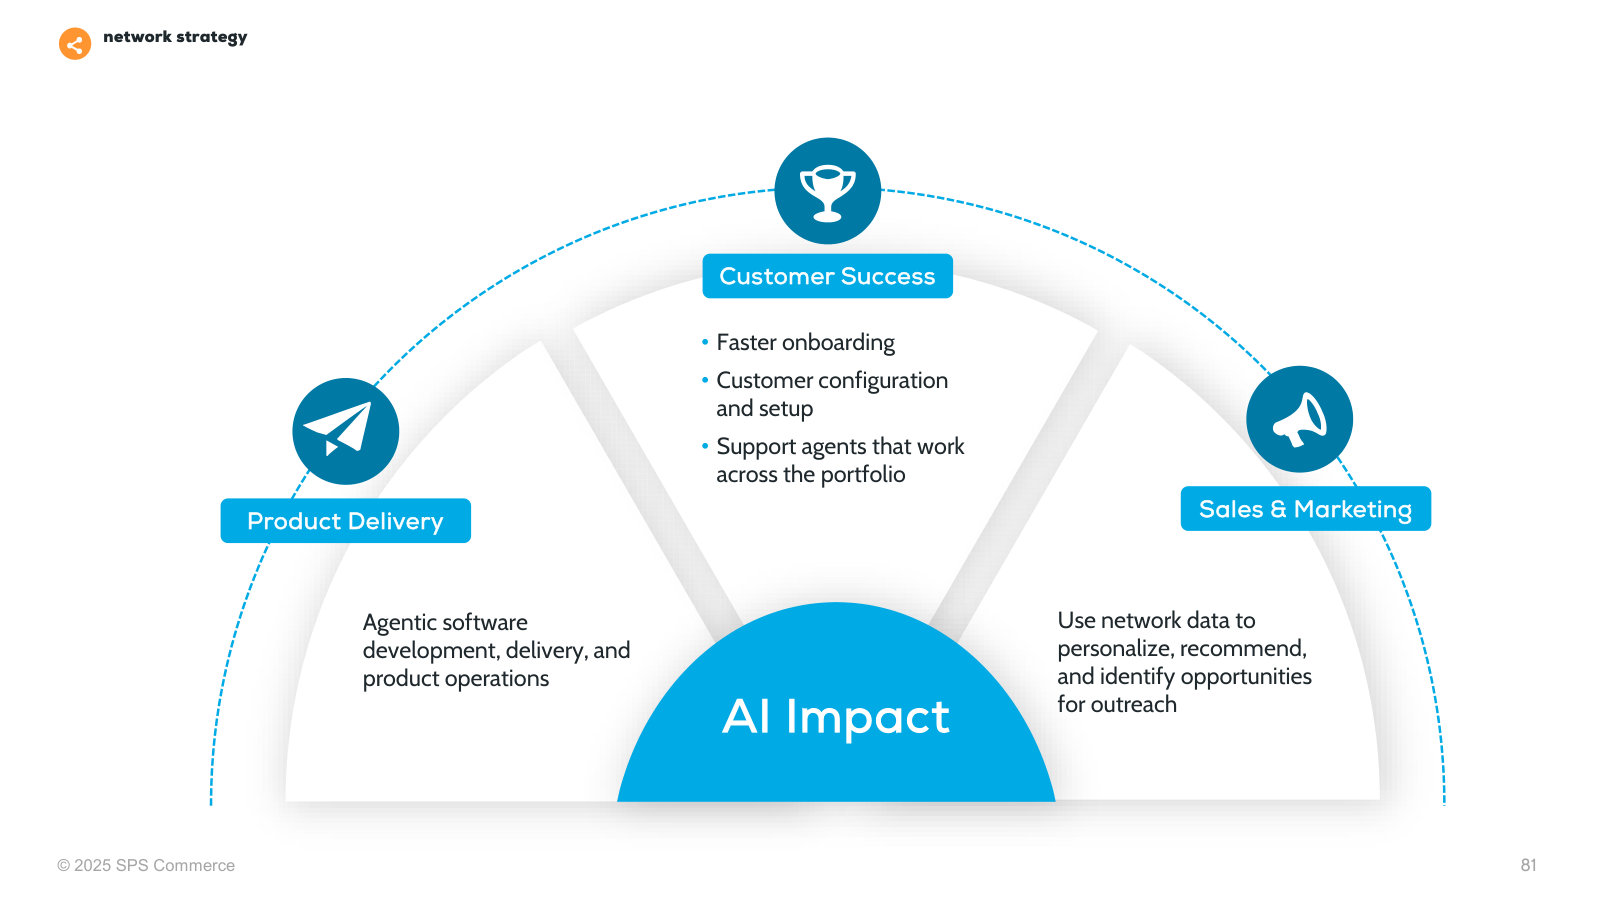
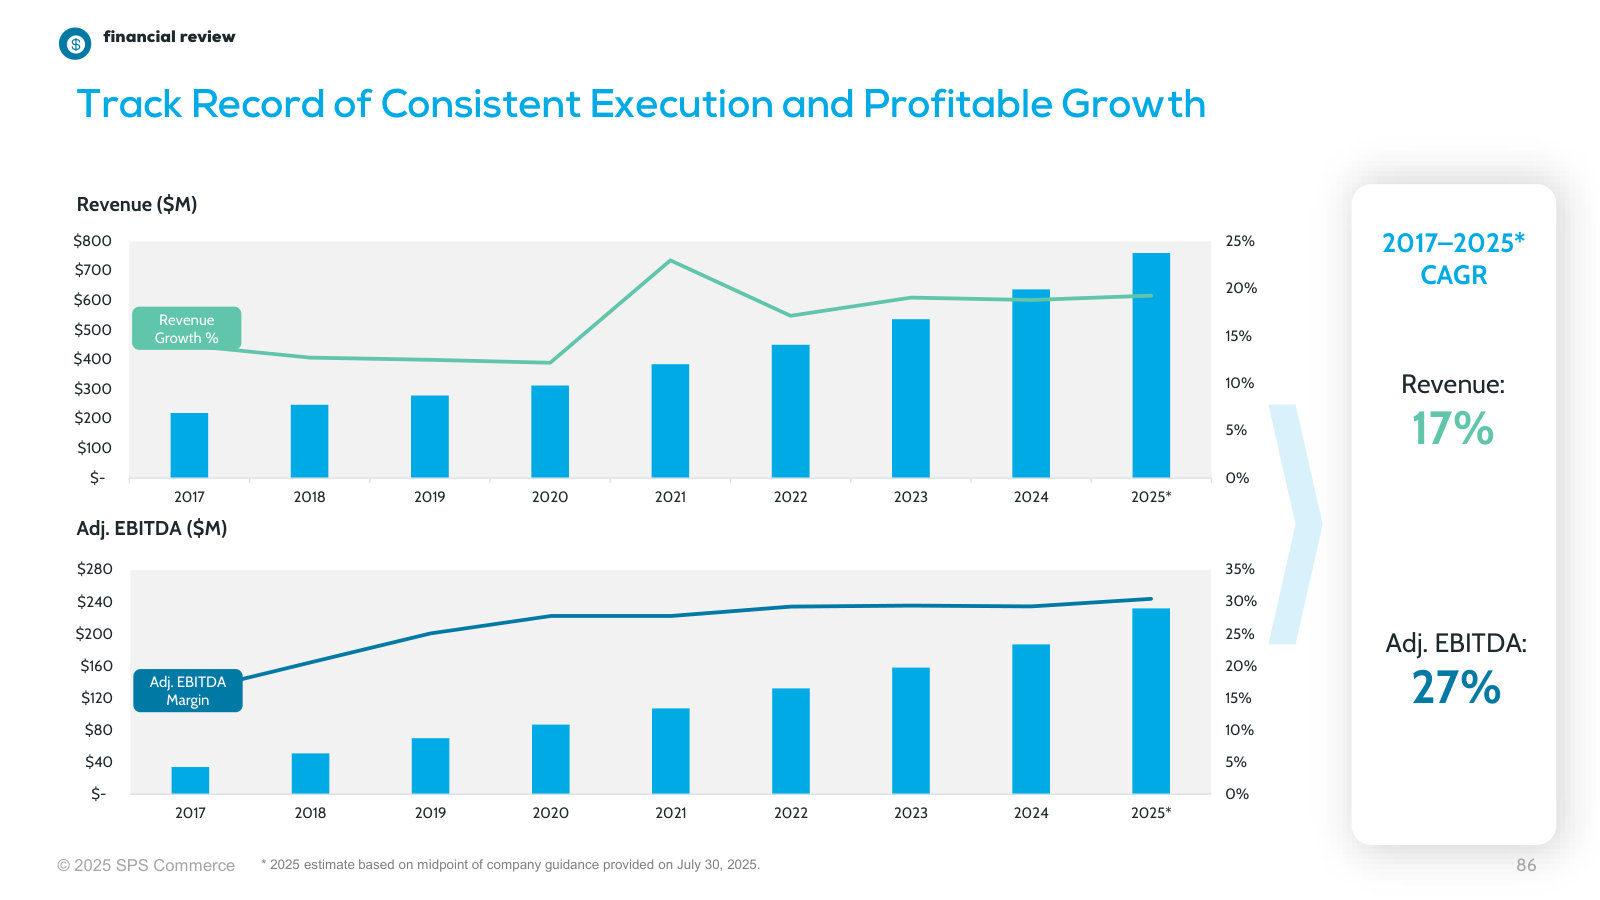
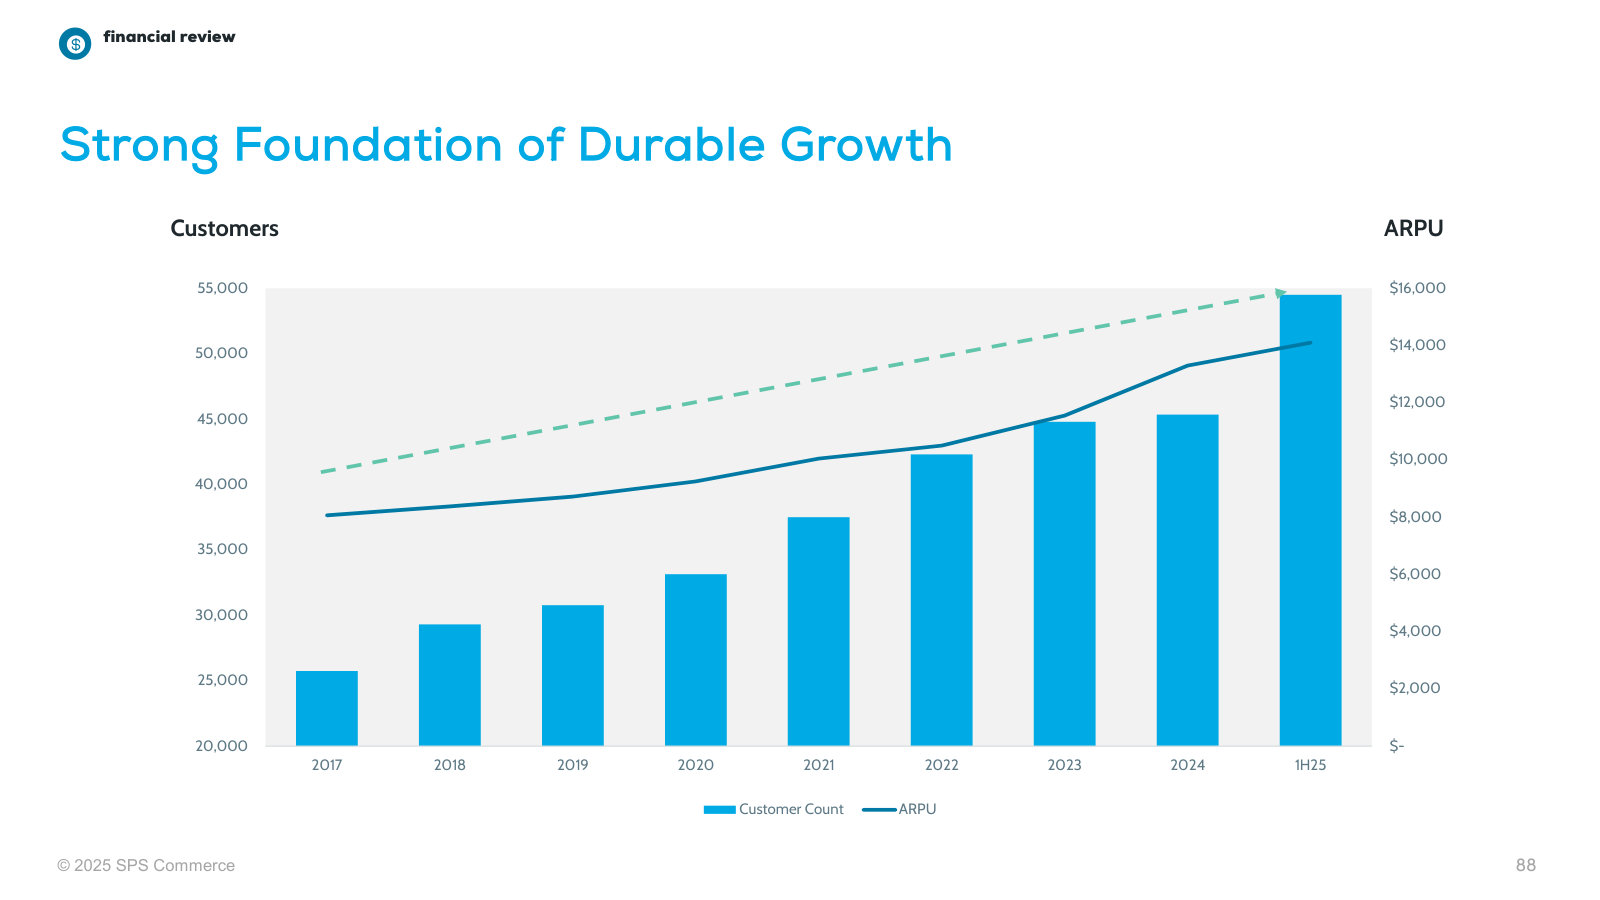
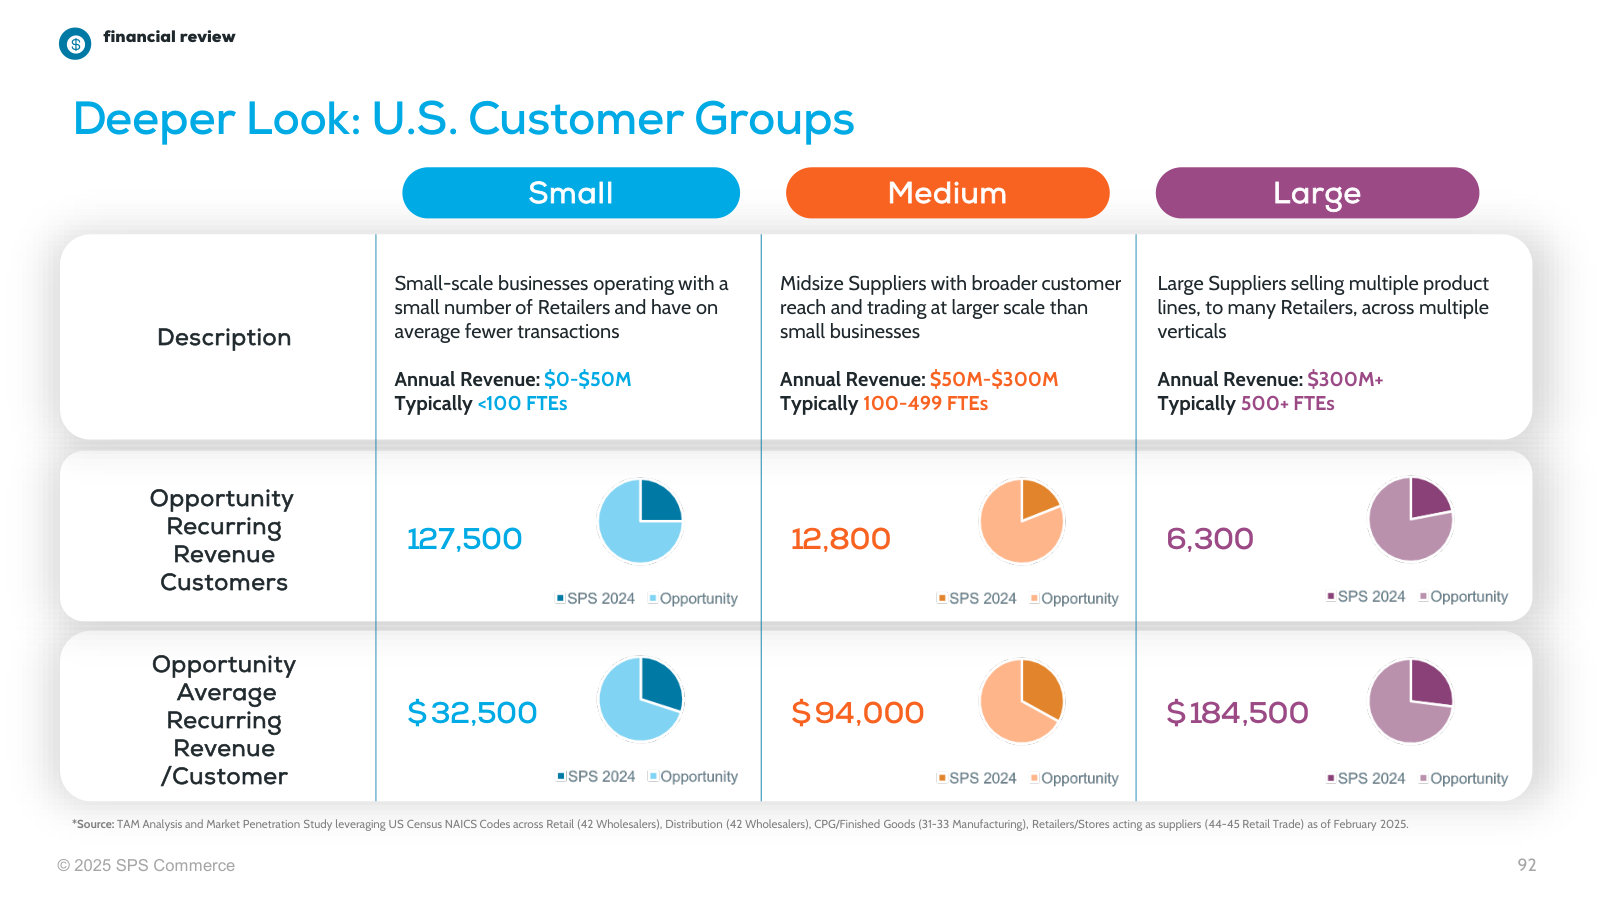
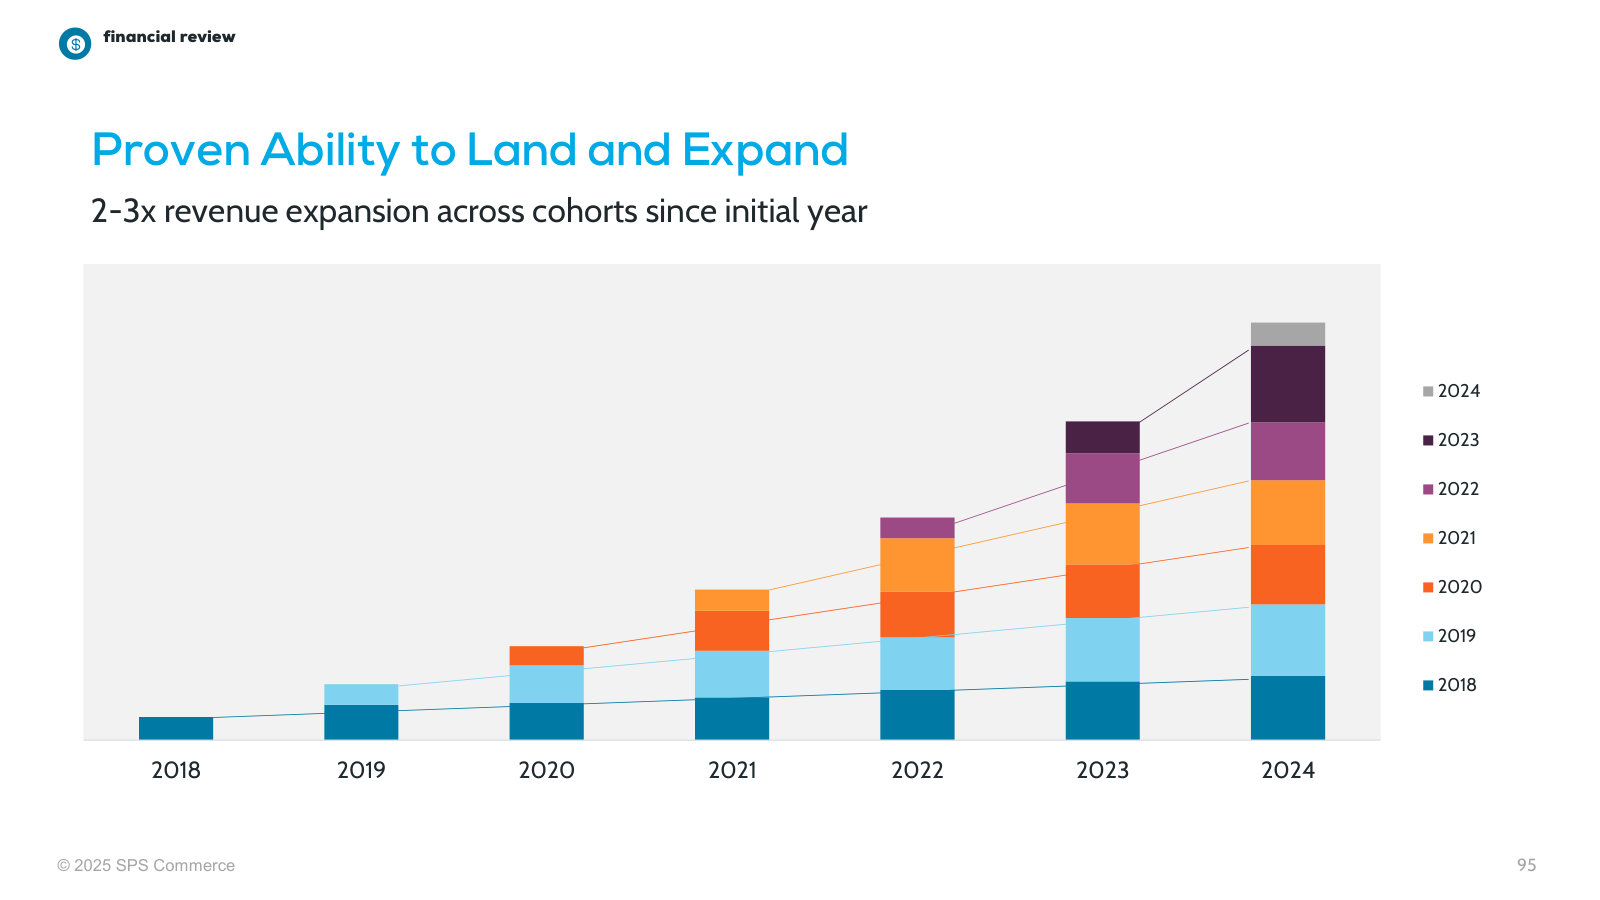
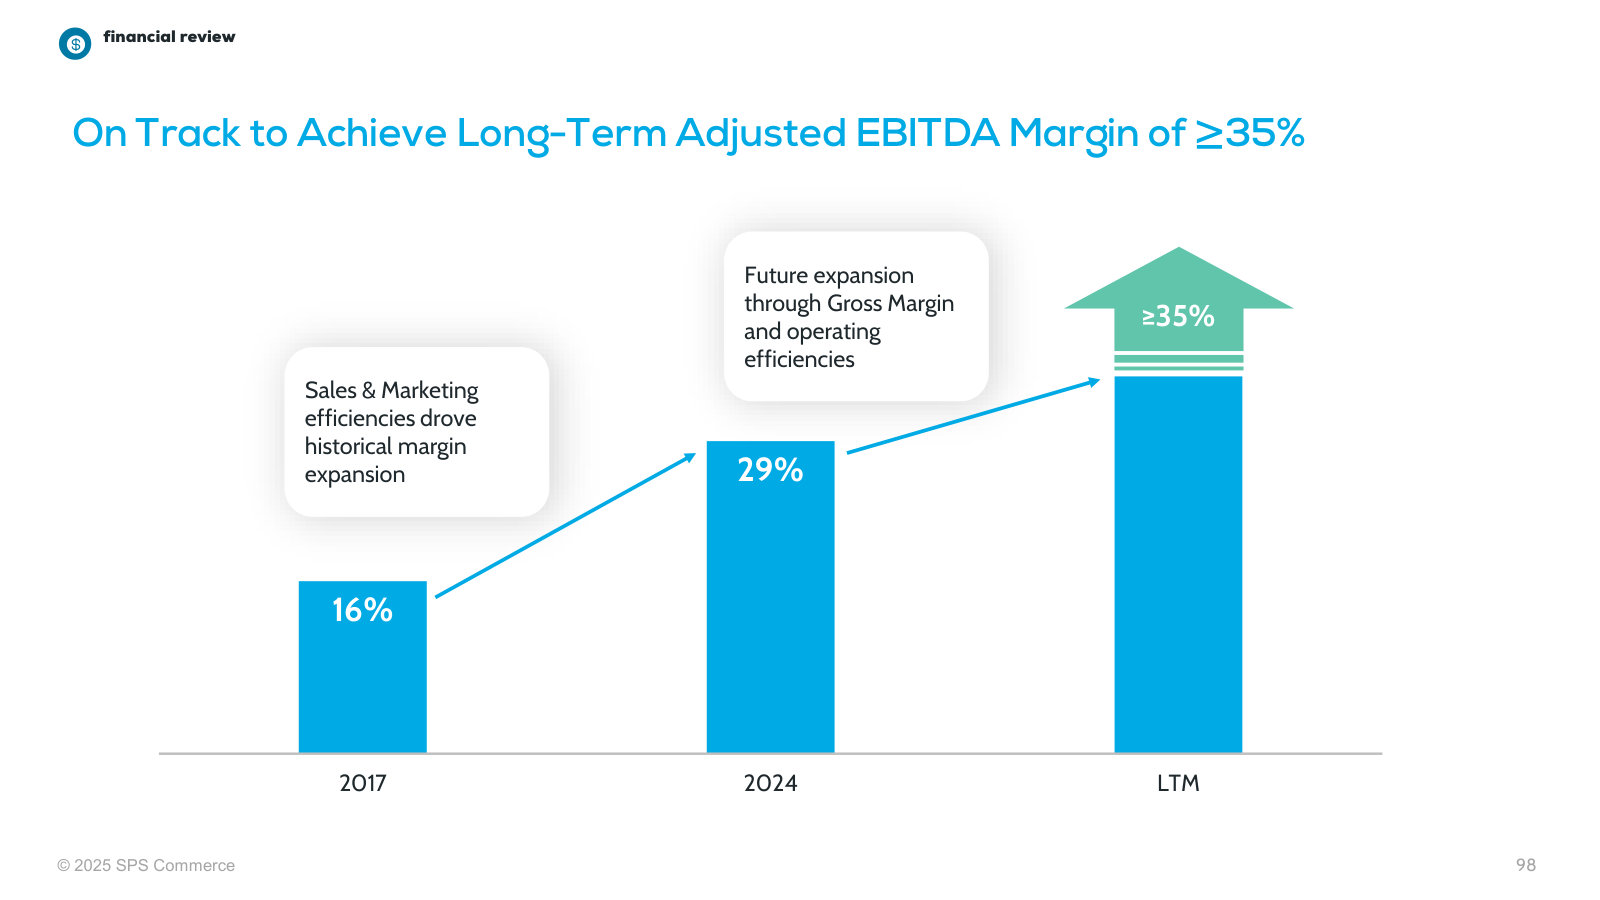
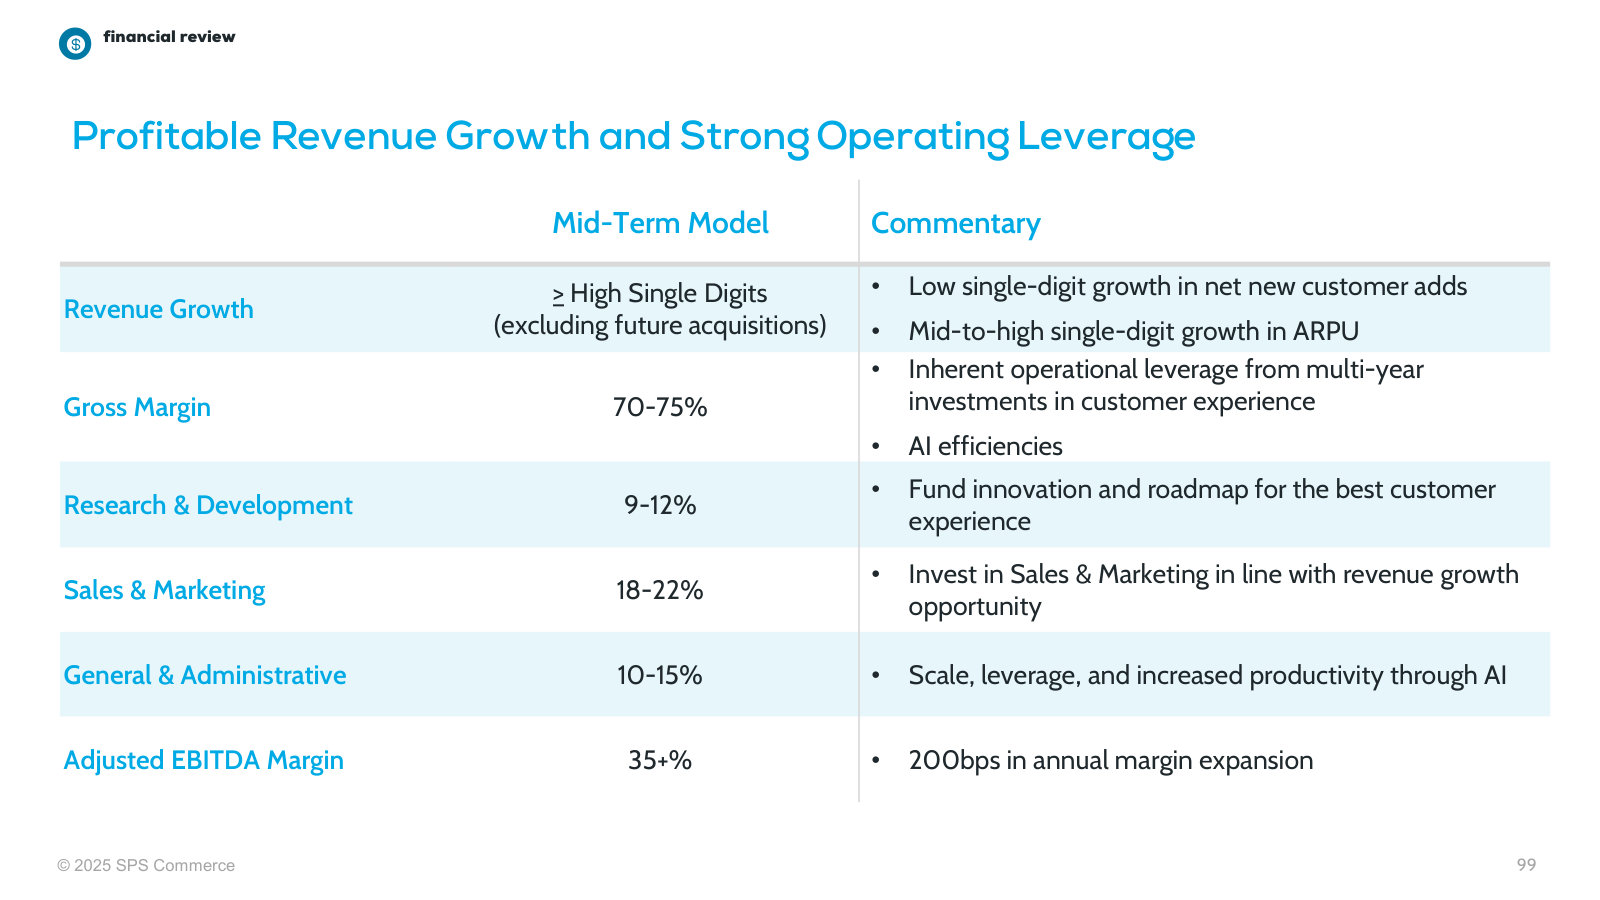
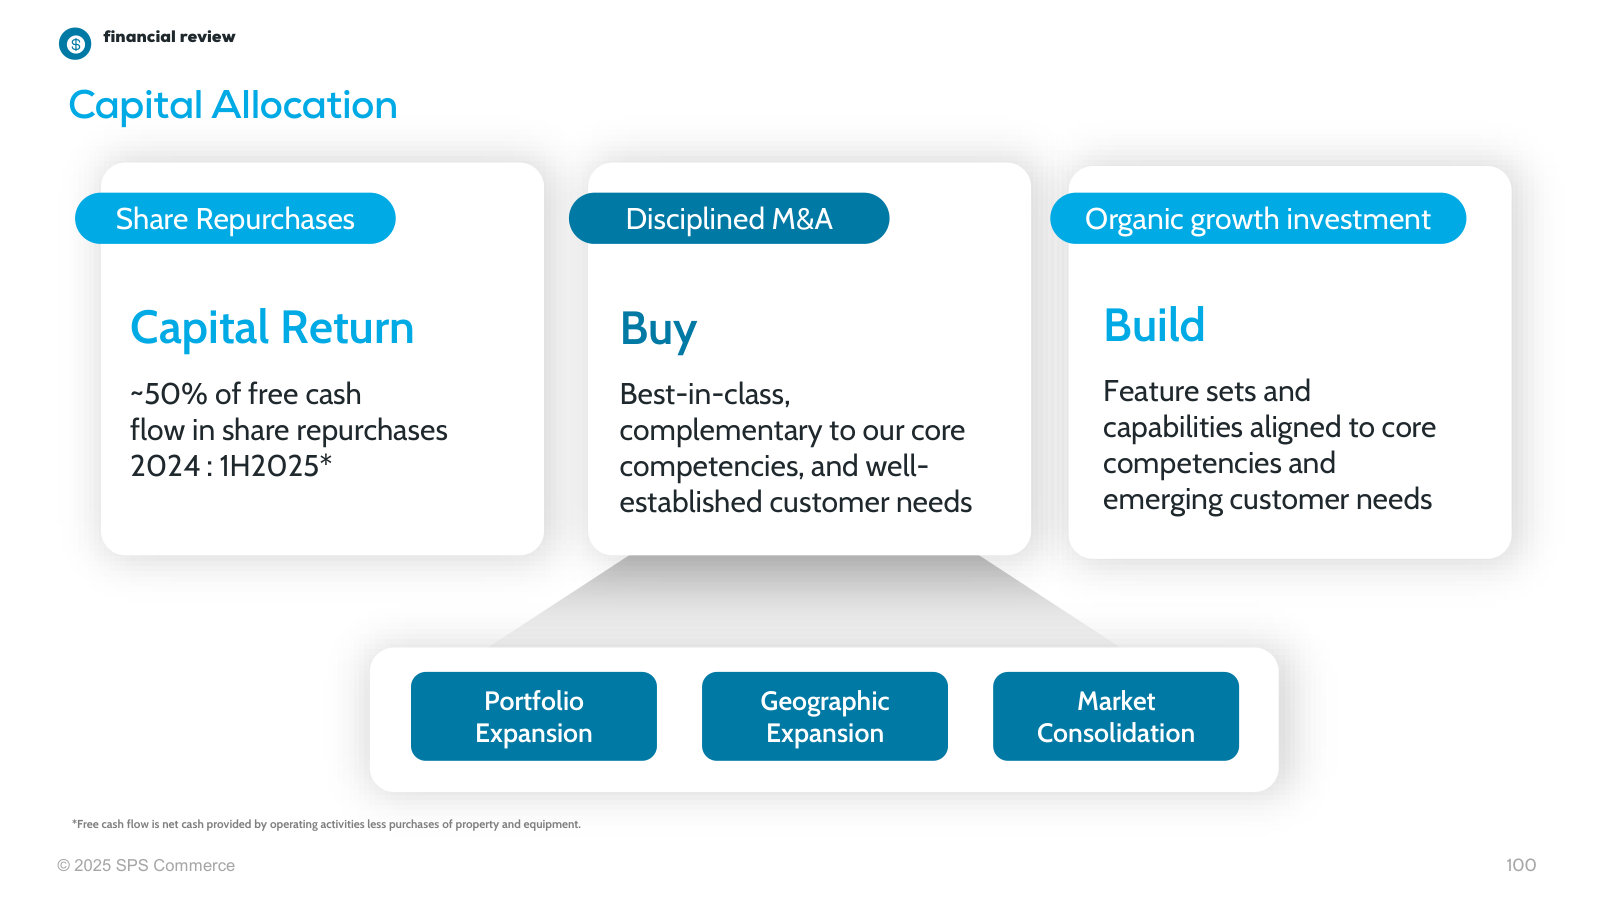
p. 7 — What SPS does, who it serves (retailers, suppliers, 3PLs) and the benefits it sells — the business in one frame. · Open the full presentation →p. 9 — The network as the hub, ringed by the six product families: relationship, performance, fulfillment, analytics, assortment, revenue recovery. · Open the full presentation →p. 13 — How retail cycles drove customer and ARPU growth by era — and why net adds slowed after the pandemic pull-forward. · Open the full presentation →p. 15 — The structural shifts SPS sells into: faster brand launches, marketplace growth, and supply-base rebalancing. · Open the full presentation →p. 18 — The land-and-expand model laid out: how SPS acquires customers and then grows revenue per customer. · Open the full presentation →p. 20 — Three growth motions — sales-led, network-led, product-led — and why the network is the engine. · Open the full presentation →p. 24 — The full retail supply-chain workflow across retailer, supplier and 3PL — the collaboration problem SPS exists to solve. · Open the full presentation →p. 27 — How SPS extends along the value chain — build, buy or partner — the framework behind its roadmap and M&A. · Open the full presentation →p. 29 — Why the network makes the products stickier: data-powered signals, system integration, and embedded expertise. · Open the full presentation →p. 34 — Retailer-facing solutions — what each does and the value it delivers. · Open the full presentation →p. 37 — Supplier and 3PL solutions — fulfillment, assortment, analytics and revenue recovery, and what each is for. · Open the full presentation →p. 42 — The lead-generation flywheel: retailer change events and retail programs continually surface new customers. · Open the full presentation →p. 43 — Win rates: in head-to-head deals SPS wins ~70%, with most losses going to no decision rather than a competitor. · Open the full presentation →p. 49 — The channel ecosystem — ERP/accounting systems and system integrators that refer customers to SPS. · Open the full presentation →p. 50 — International reach: marquee global brands already on the network and the plan to replay the U.S. playbook abroad. · Open the full presentation →p. 52 — What triggers a customer to spend more — new trading partners, new retailer requirements, rising order volume. · Open the full presentation →p. 55 — One customer's 70x growth over two years as it added retailers, partners and products — land-and-expand in one chart. · Open the full presentation →p. 62 — Twenty-five years of network growth, visualized as trading connections compounding from 2010 to 2025. · Open the full presentation →p. 63 — The network's scale: 300,000+ trading relationships, $650B+ in transaction value, 33M+ SKUs, 780M+ documents. · Open the full presentation →p. 64 — What the network is built to be — protocol-agnostic, AI-enabled, scalable and secure. · Open the full presentation →p. 69 — The core pain point: retailers rarely document their rules of engagement completely or keep them current. · Open the full presentation →p. 71 — The data moat — the network shows what retailers actually do, not just what their rulebooks say. · Open the full presentation →p. 79 — The customer-facing network agent — a conversational layer answering fulfillment questions from network data. · Open the full presentation →p. 81 — Where AI is applied internally — customer success, product delivery, and sales & marketing. · Open the full presentation →p. 86 — The financial track record: revenue and adjusted EBITDA compounding at ~17% and ~27% since 2017. · Open the full presentation →p. 88 — The twin growth drivers over time — more customers and higher revenue per customer (ARPU). · Open the full presentation →p. 92 — U.S. customers segmented small/medium/large, with the revenue-per-customer opportunity in each tier. · Open the full presentation →p. 95 — Land-and-expand proven across cohorts: each customer vintage roughly doubles-to-triples revenue over time. · Open the full presentation →p. 98 — The margin path — adjusted EBITDA margin from 16% (2017) toward the >=35% long-term target. · Open the full presentation →p. 99 — The mid-term operating model — target gross margin, opex ranges and the >=35% adjusted EBITDA margin. · Open the full presentation →p. 100 — Capital allocation — buybacks (~50% of free cash flow), disciplined M&A, and organic investment. · Open the full presentation →
The compact, current company overview — the investment case, the new MAX AI line, and the latest financials and proof points. · Open the full document →
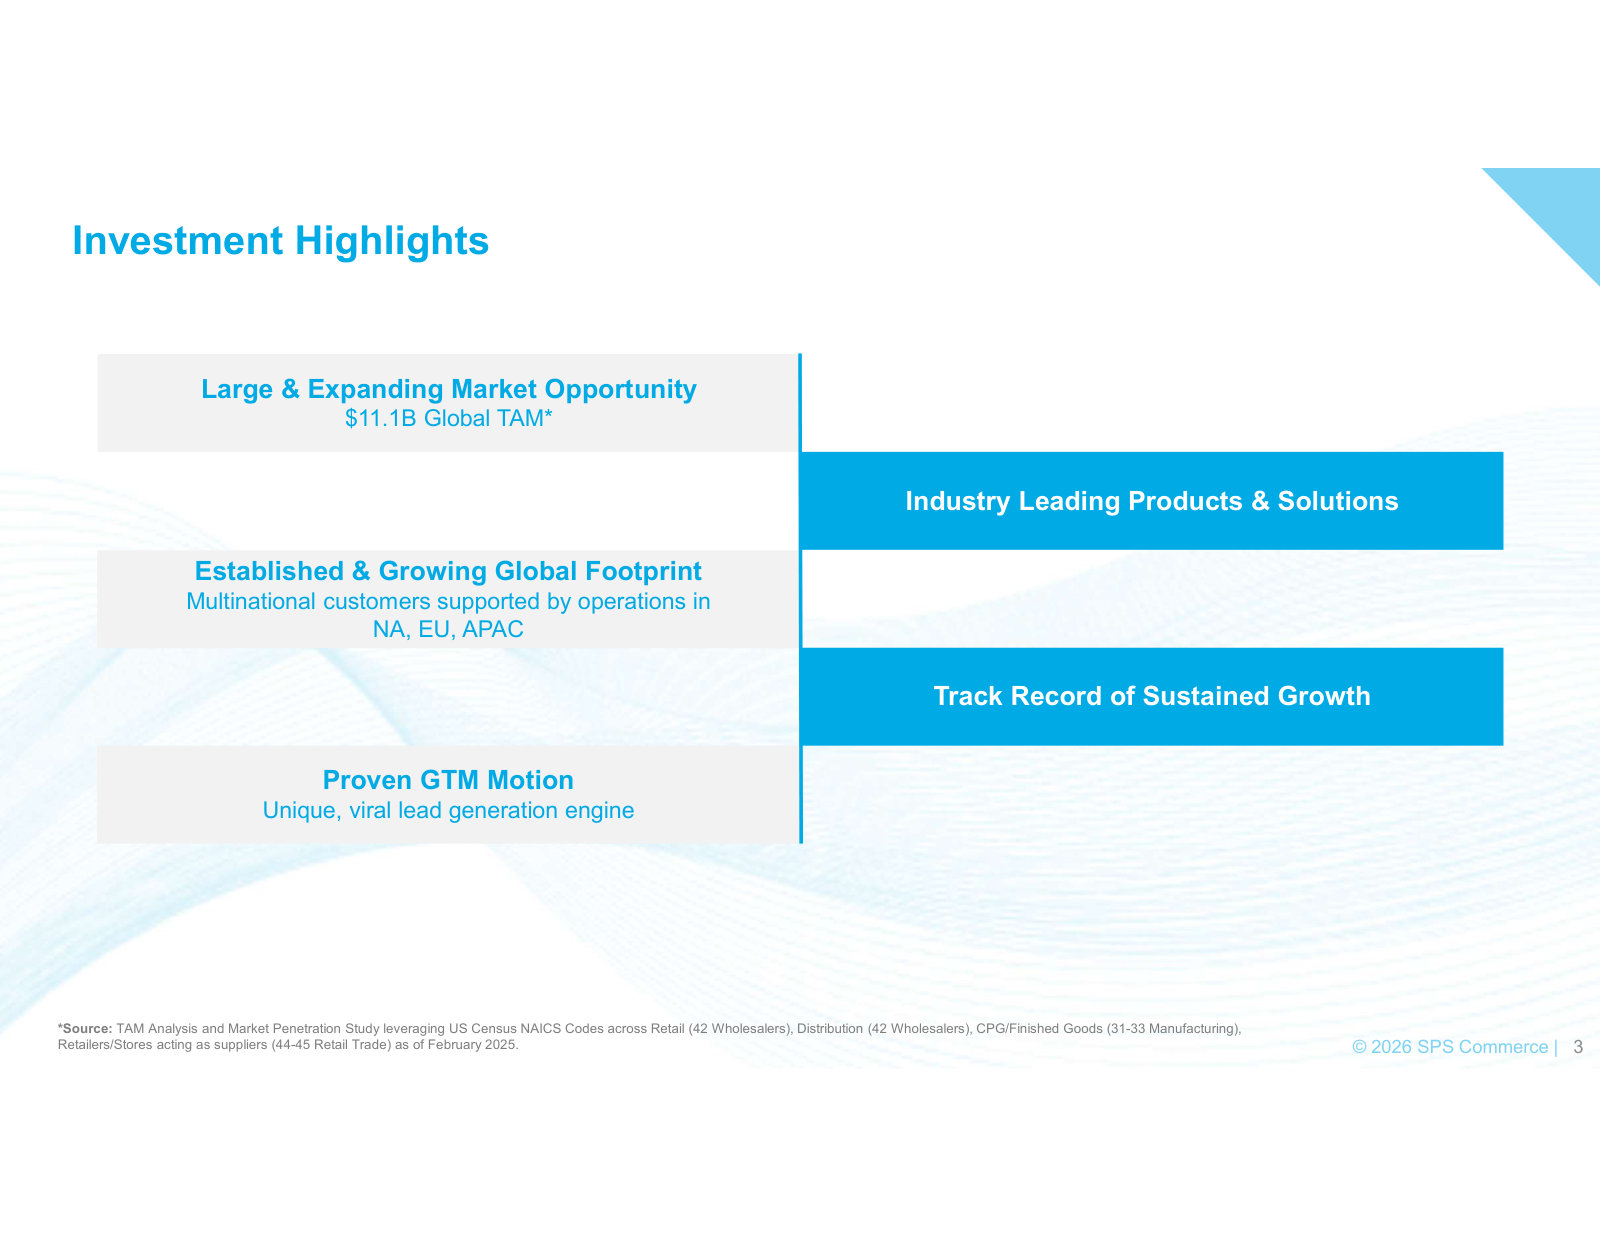
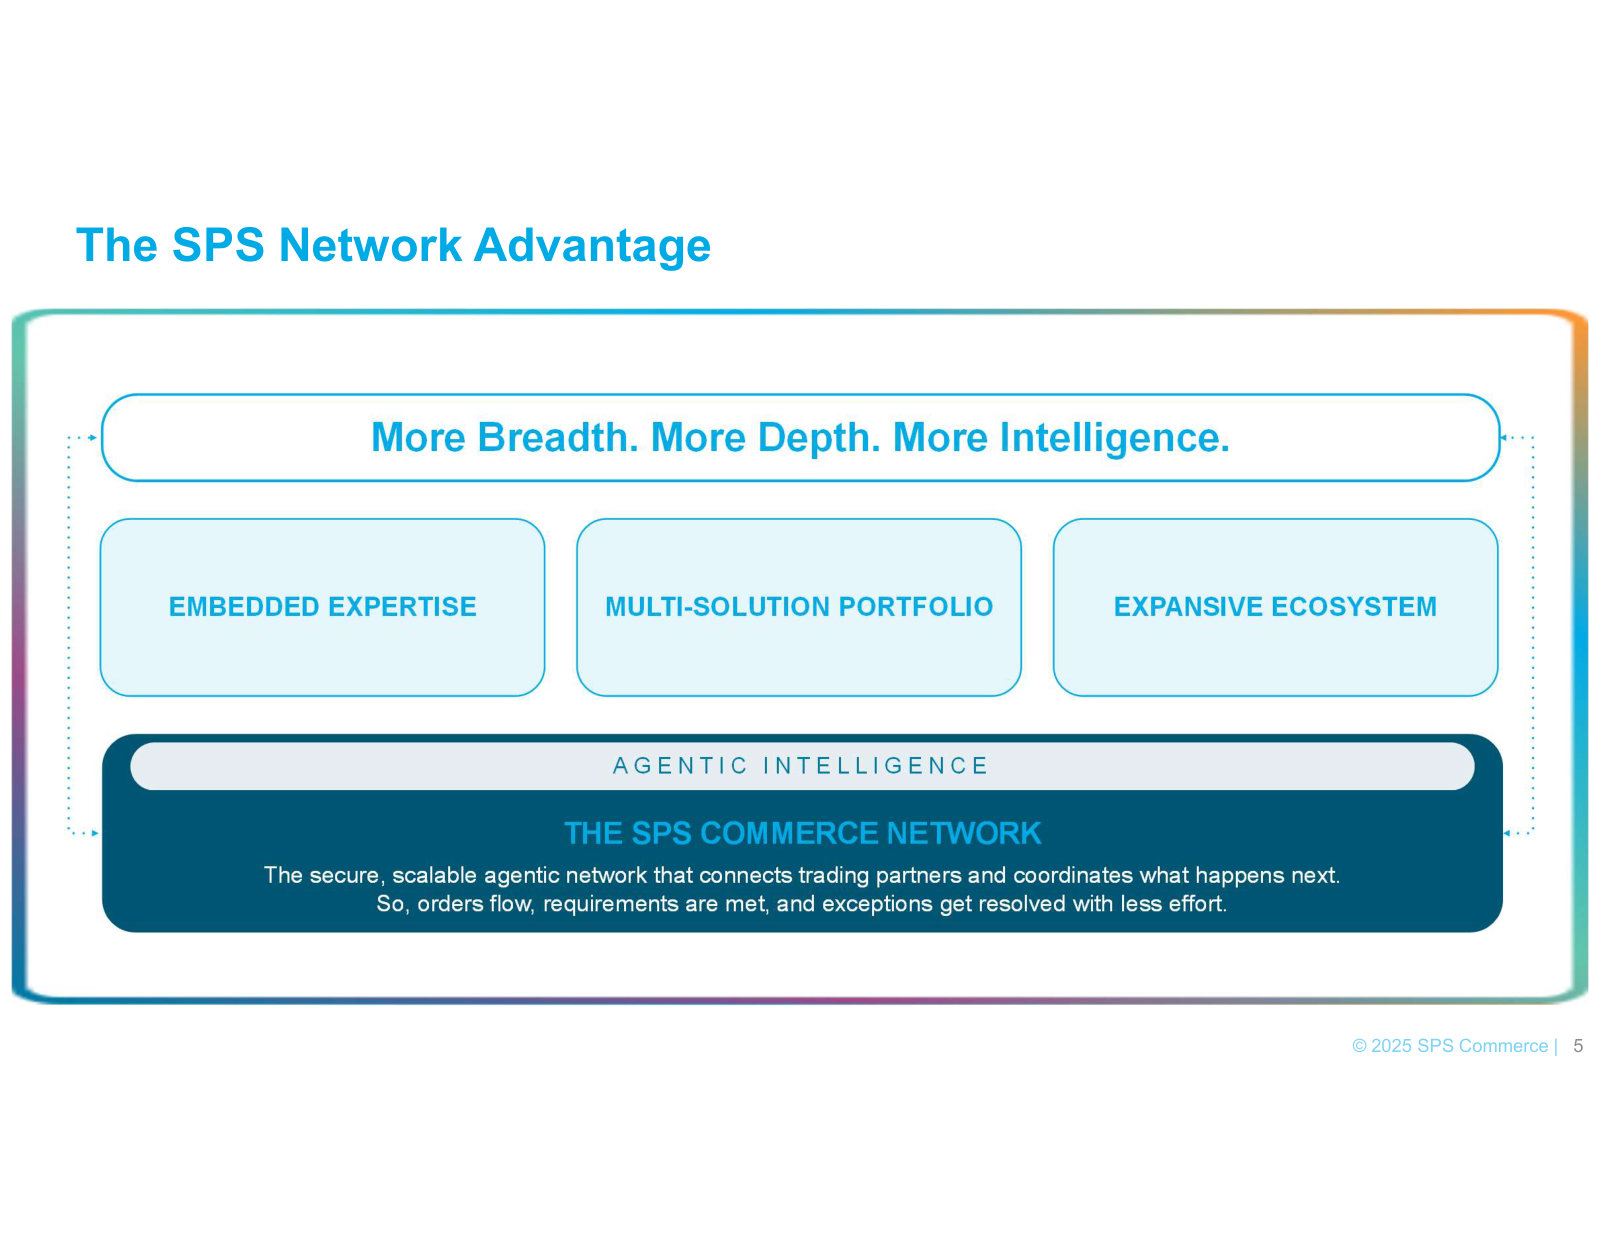
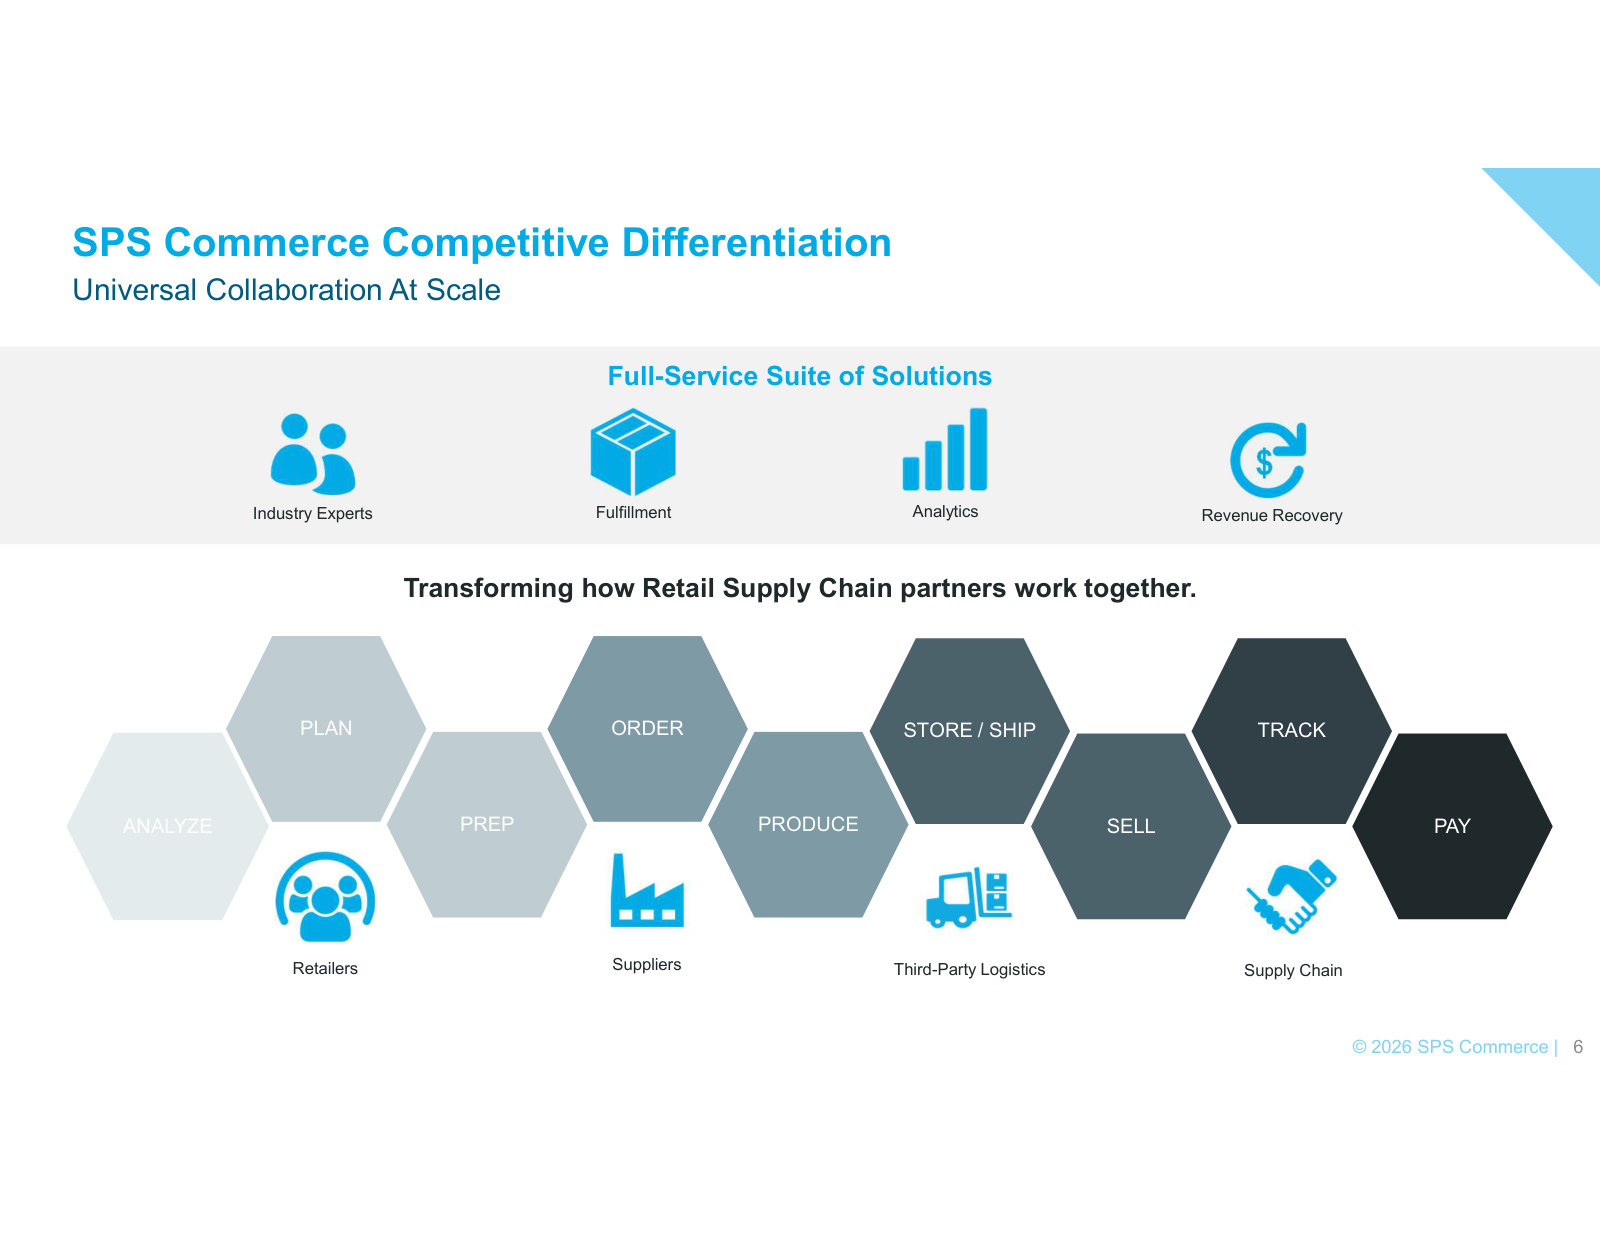
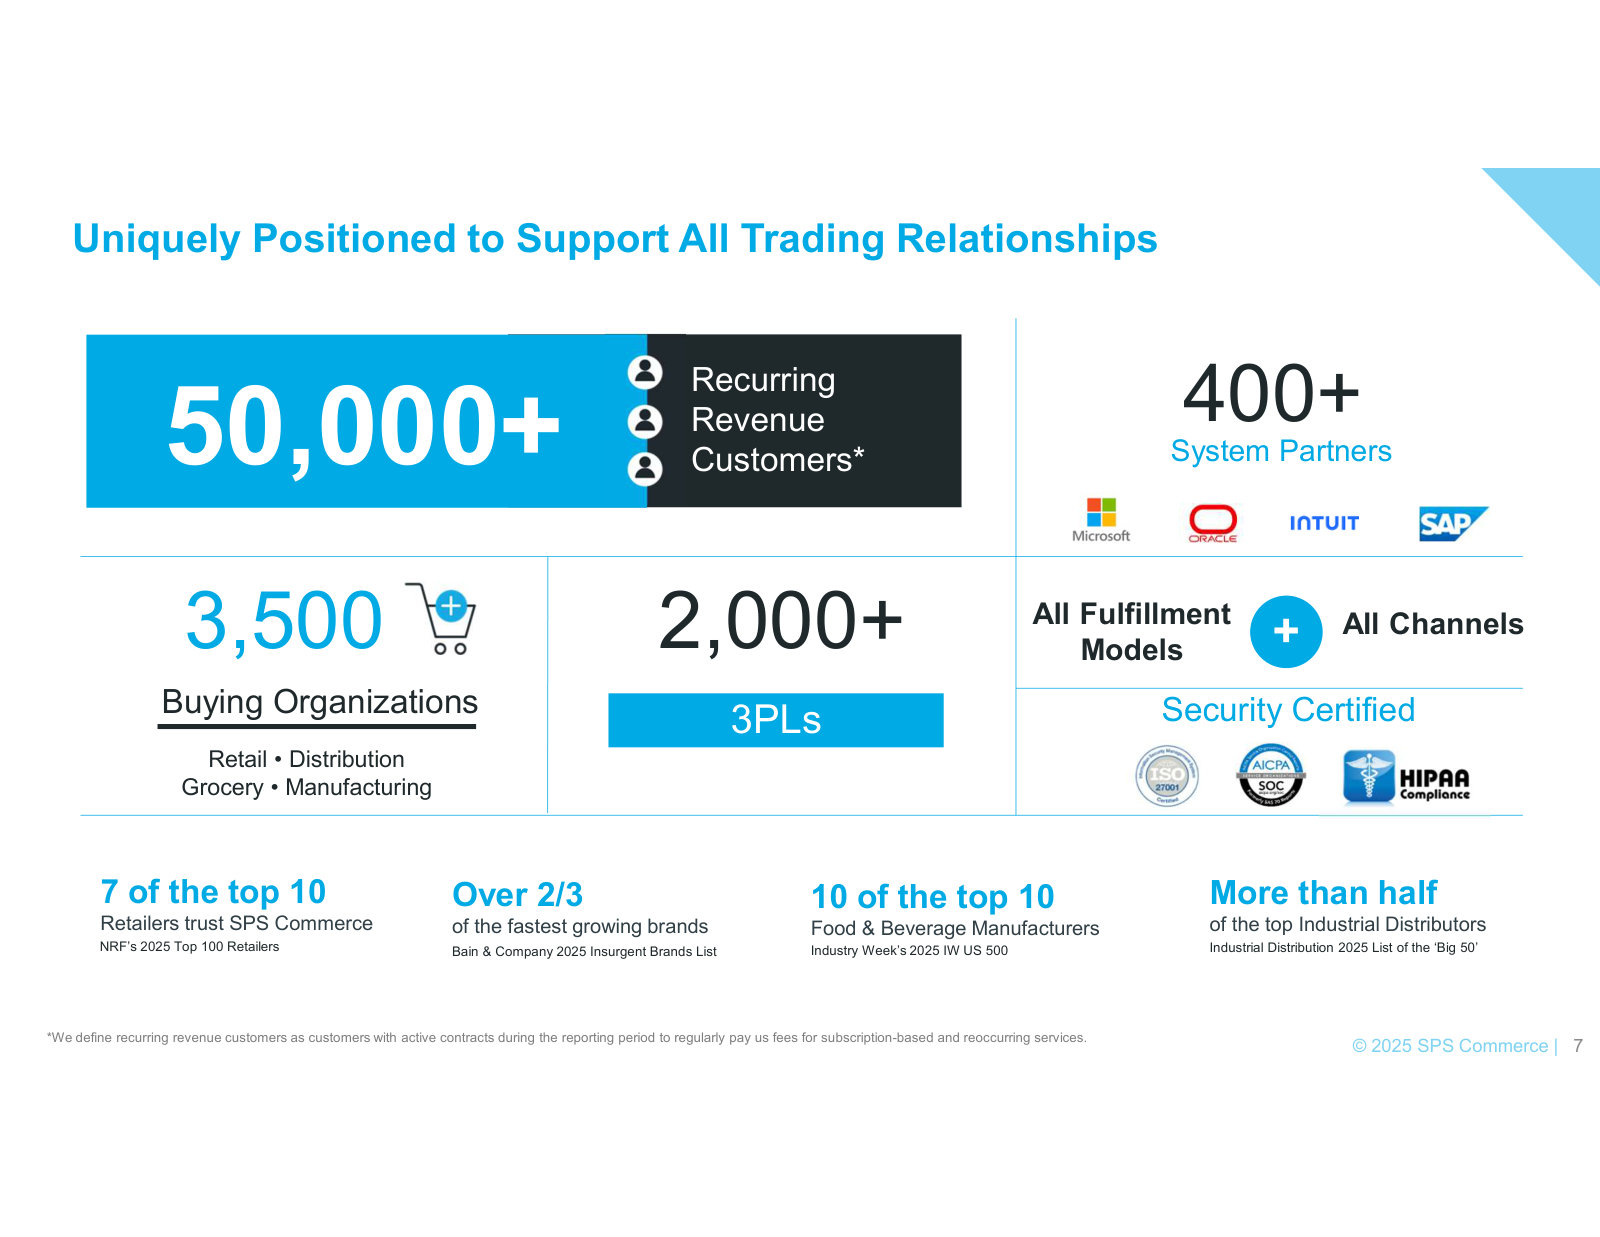
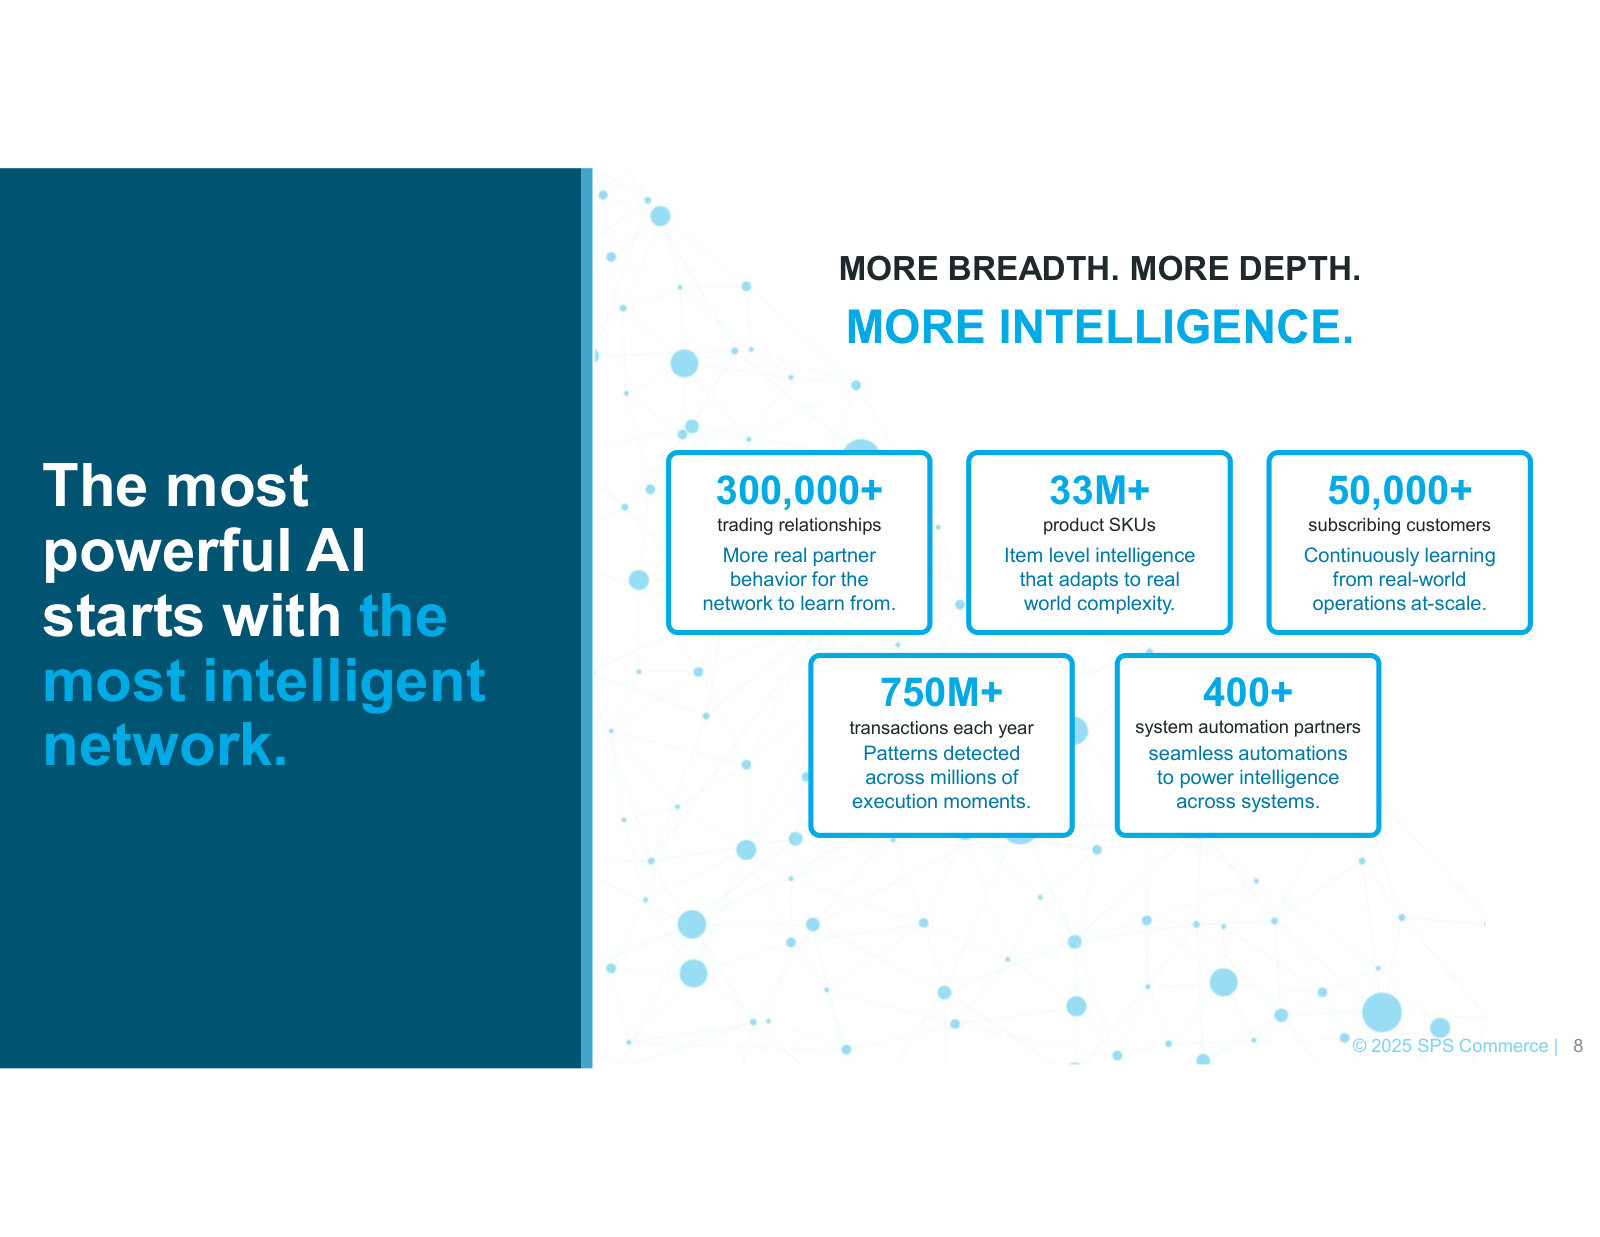
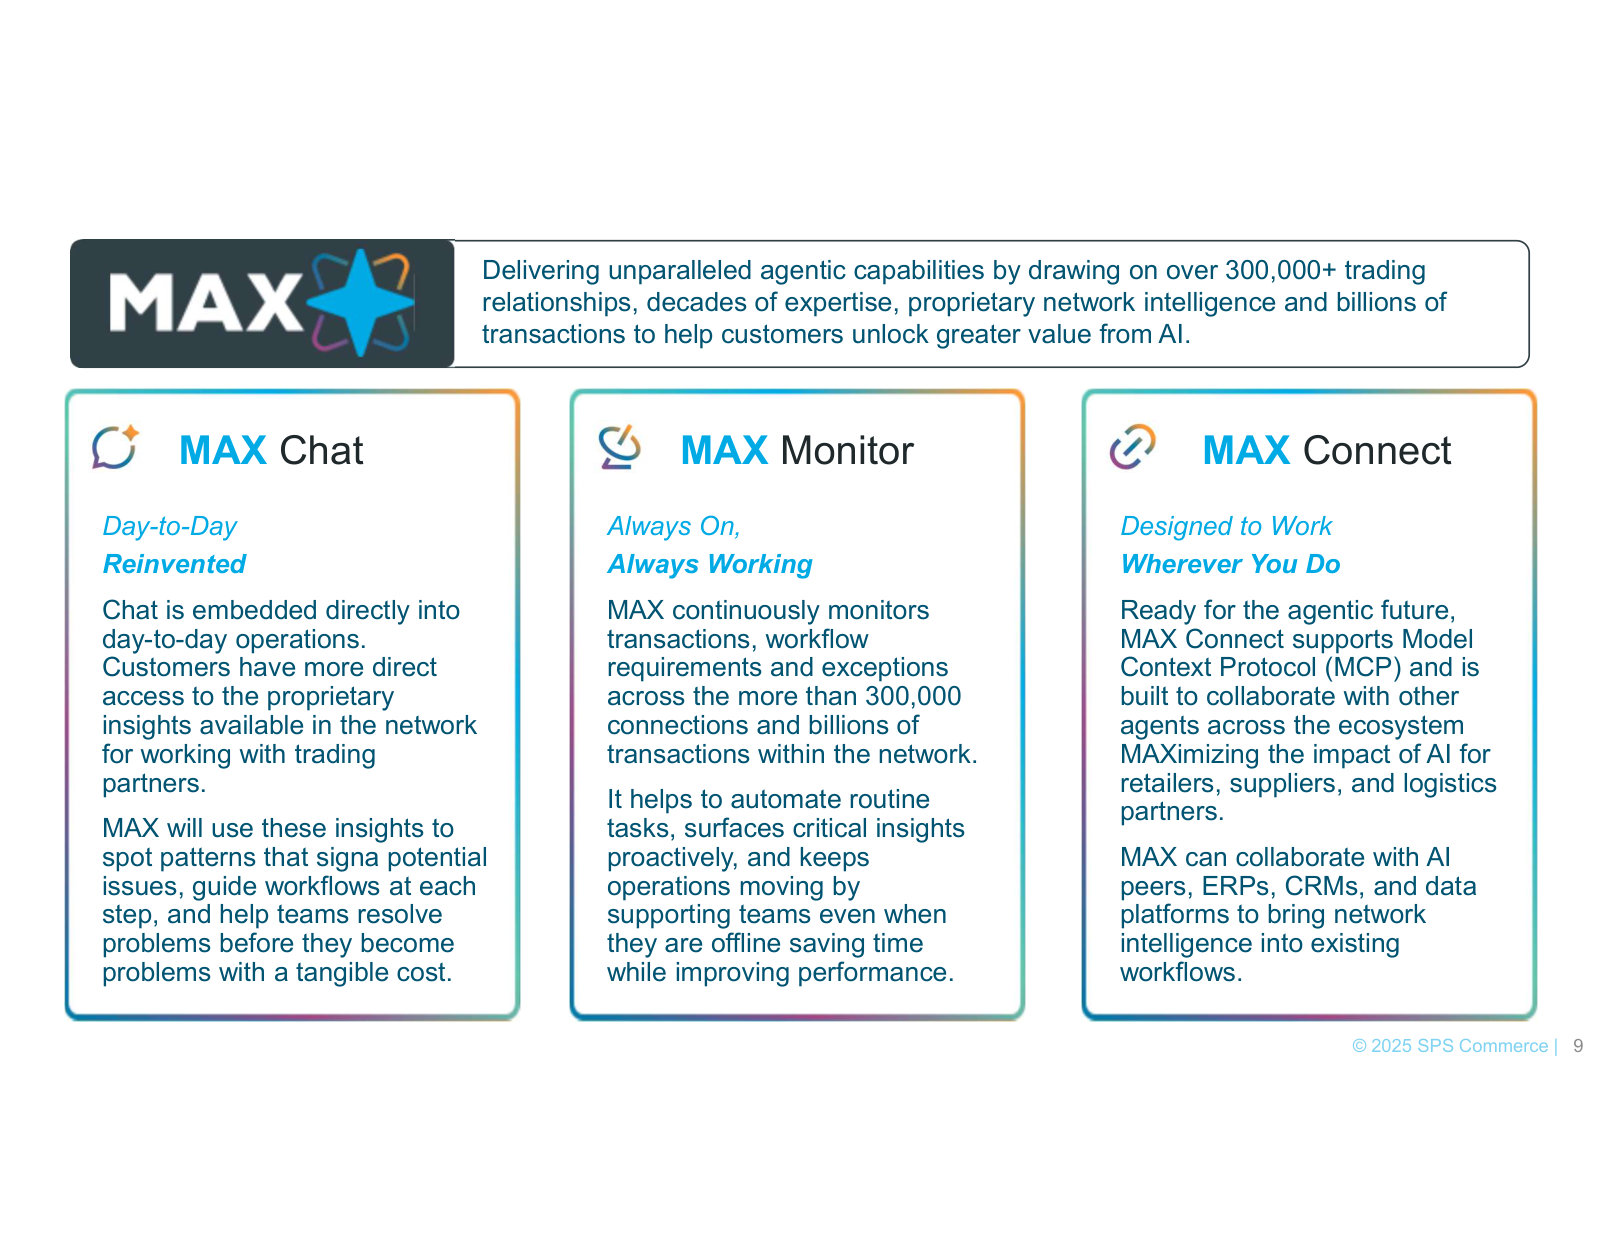
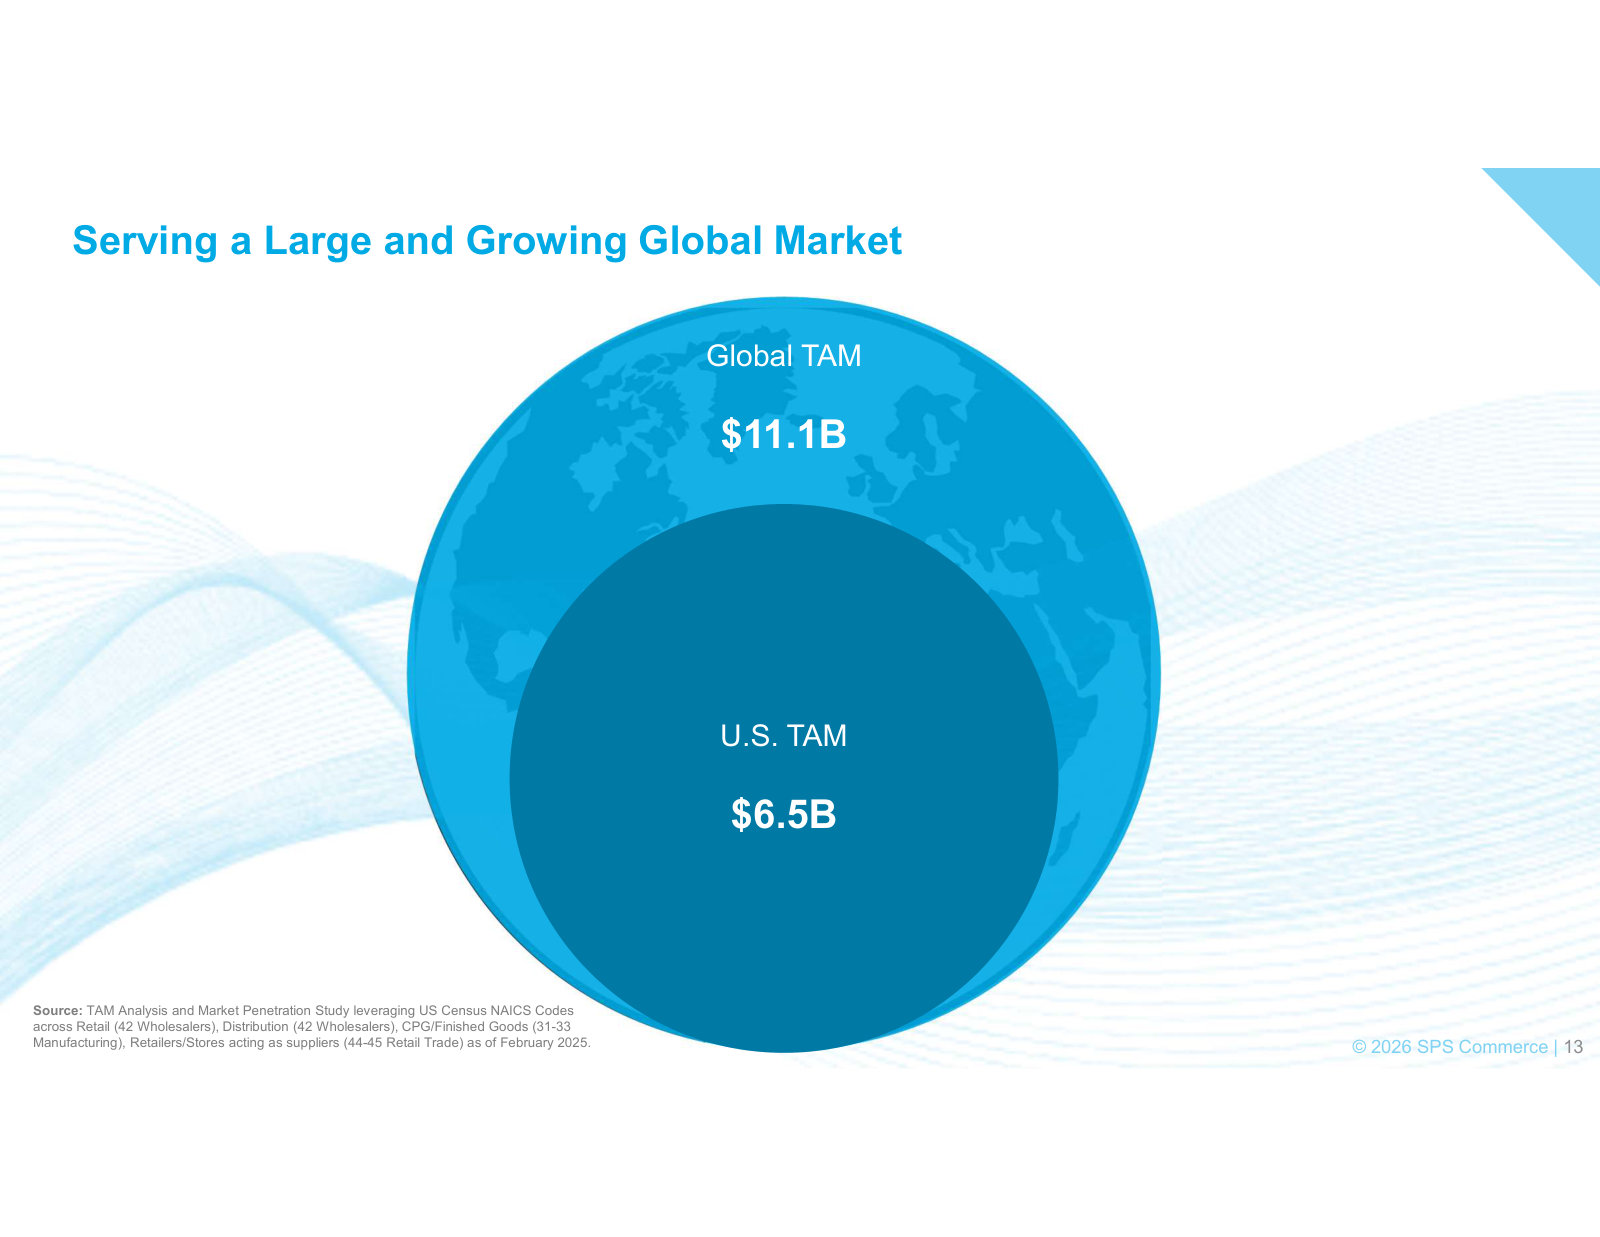
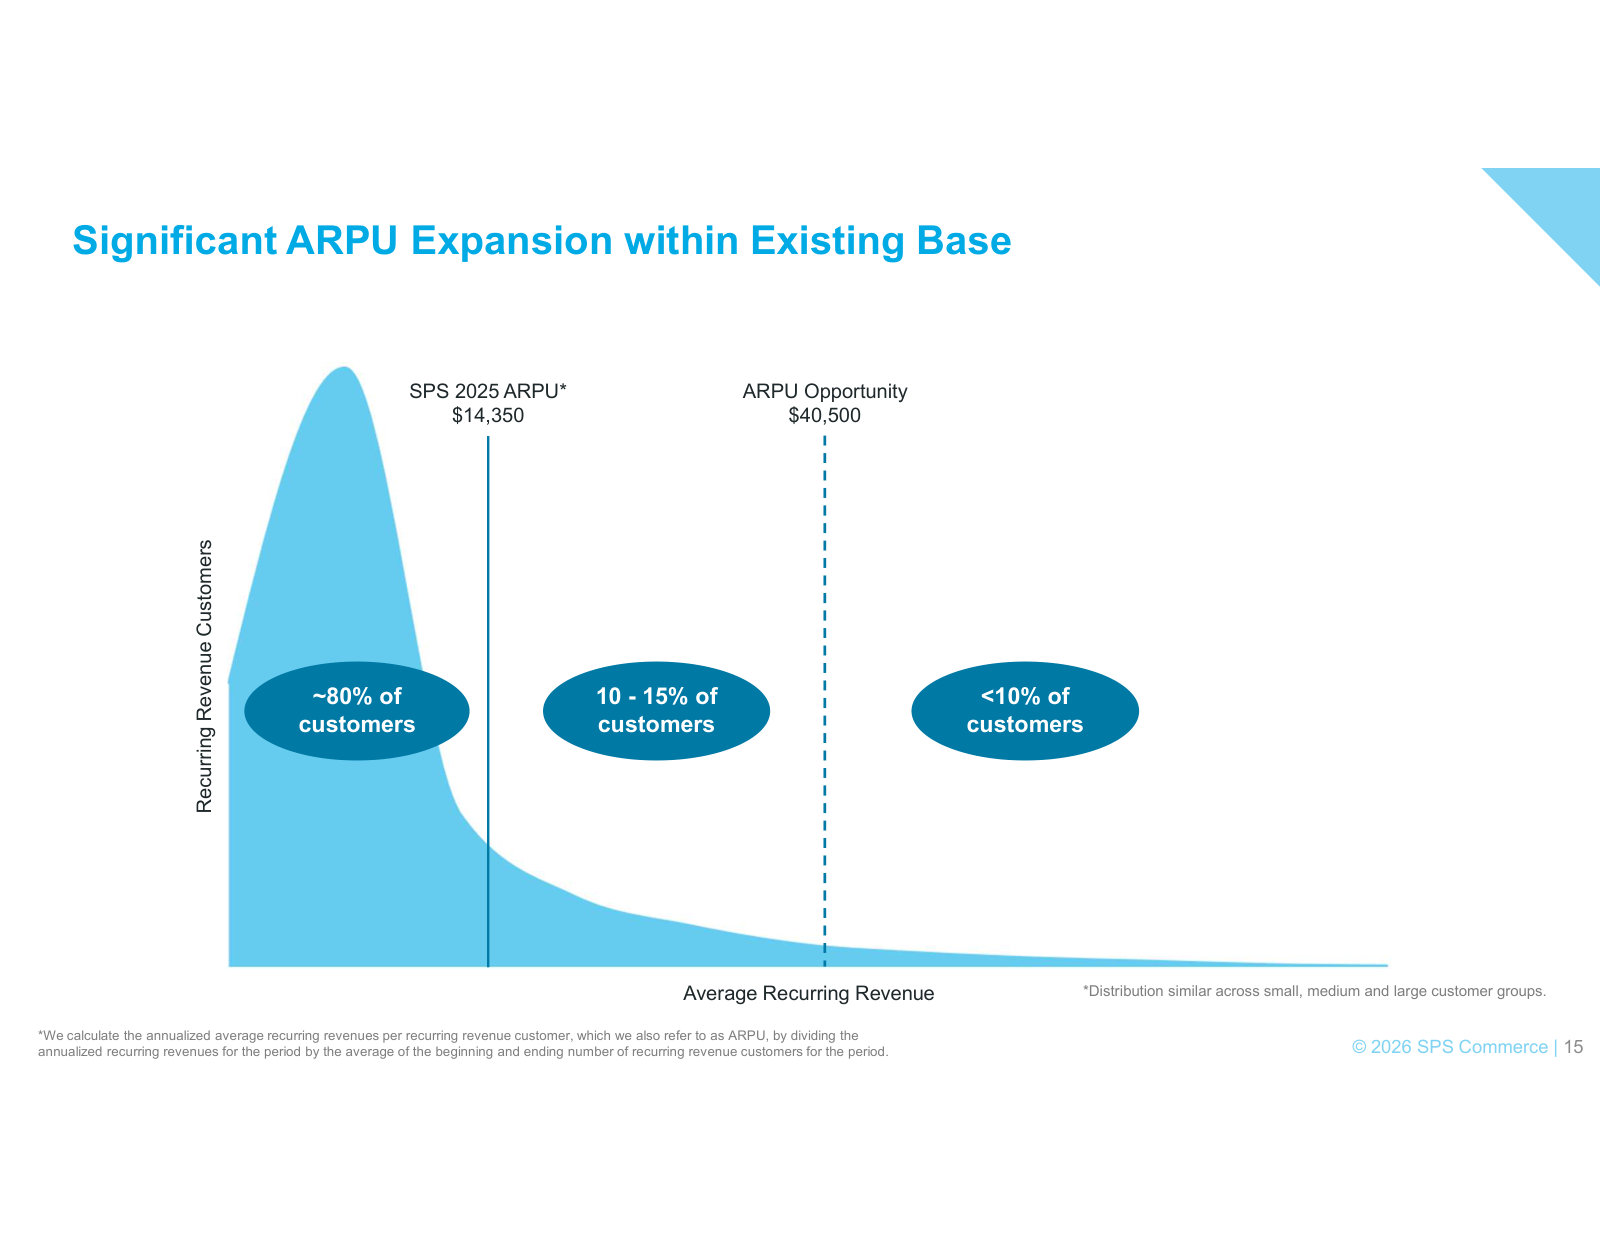
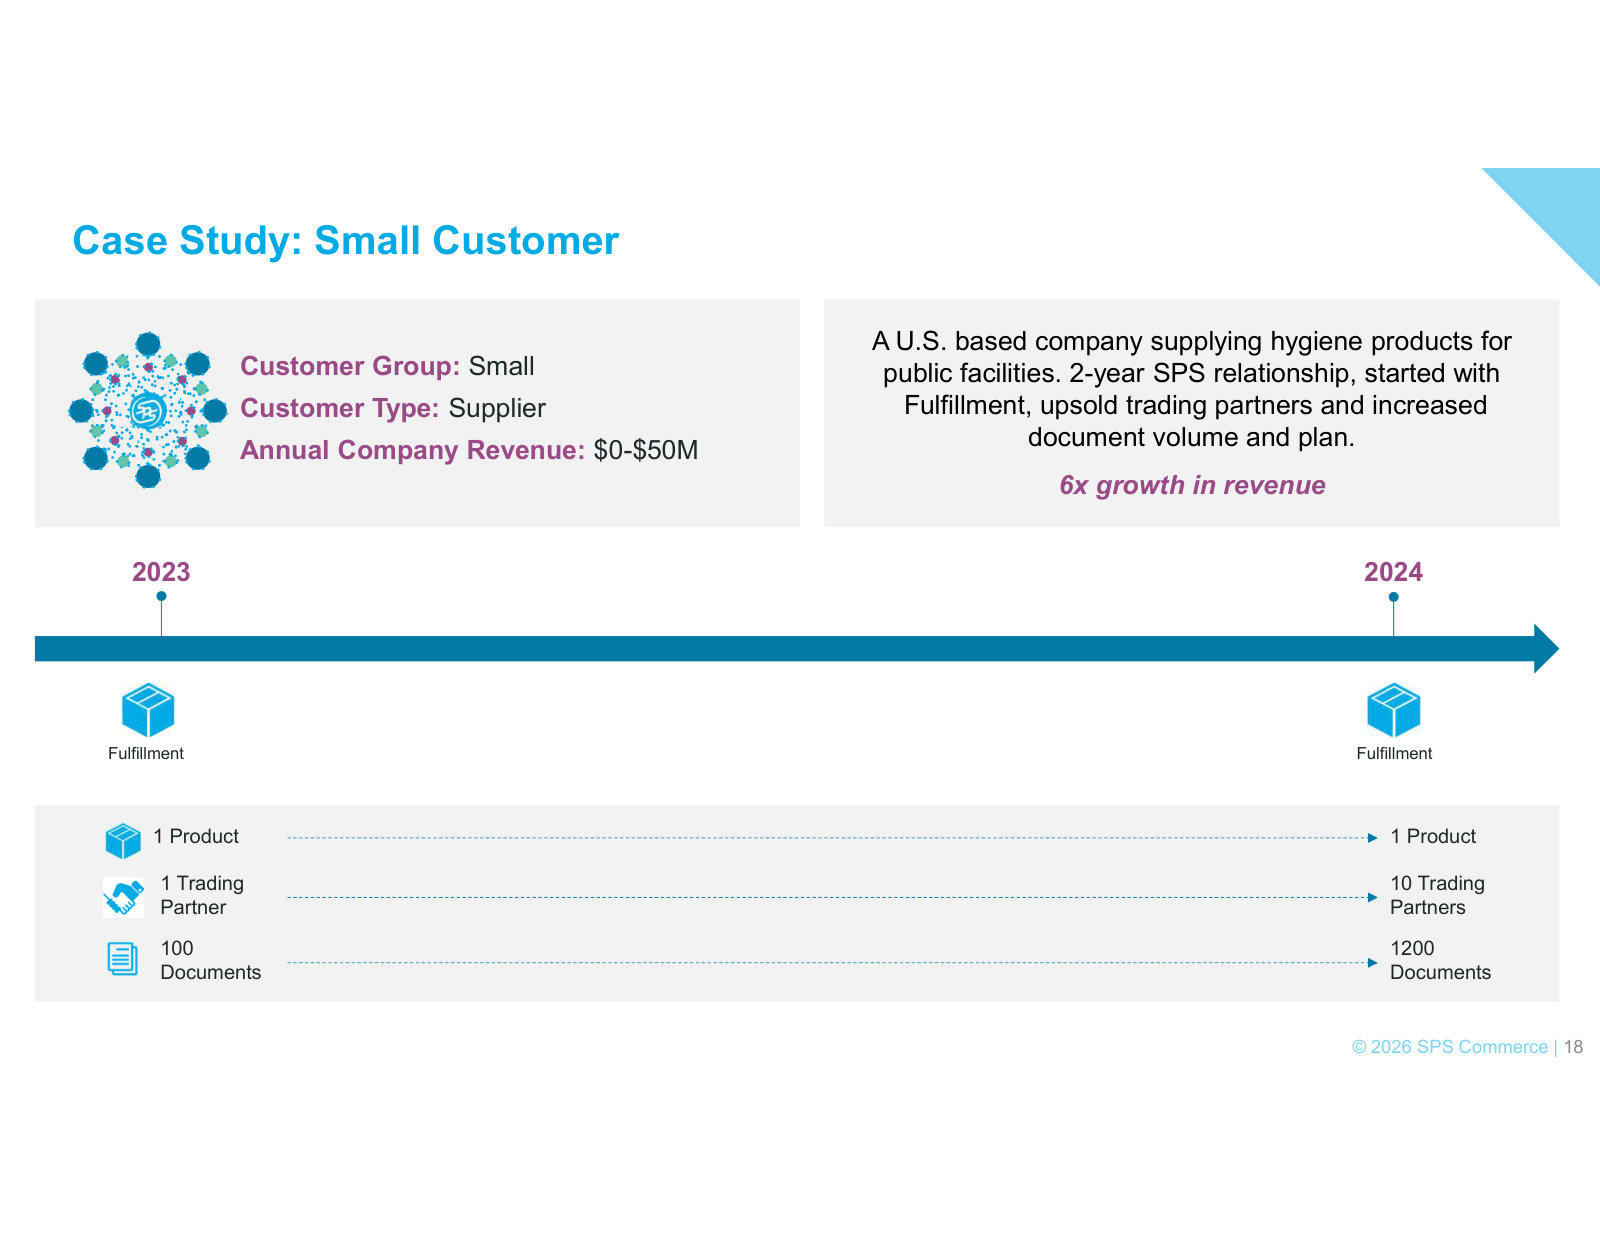
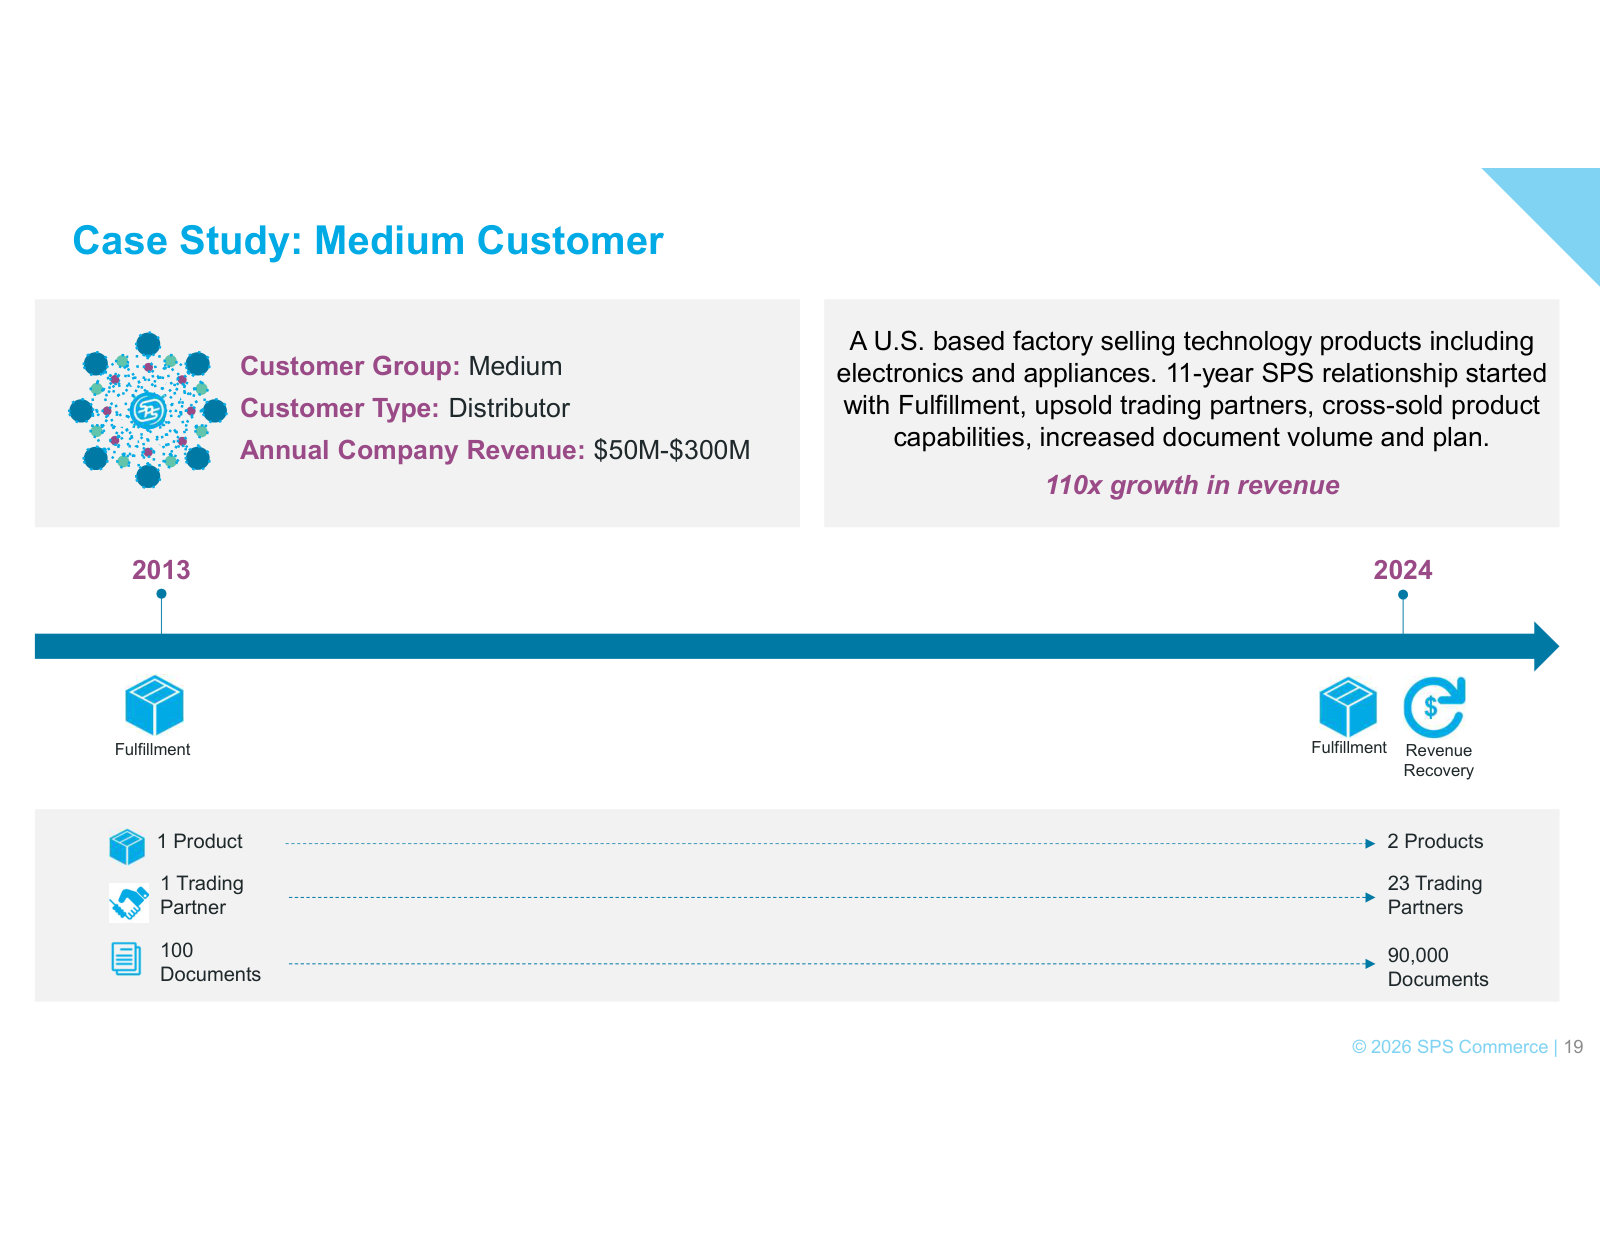
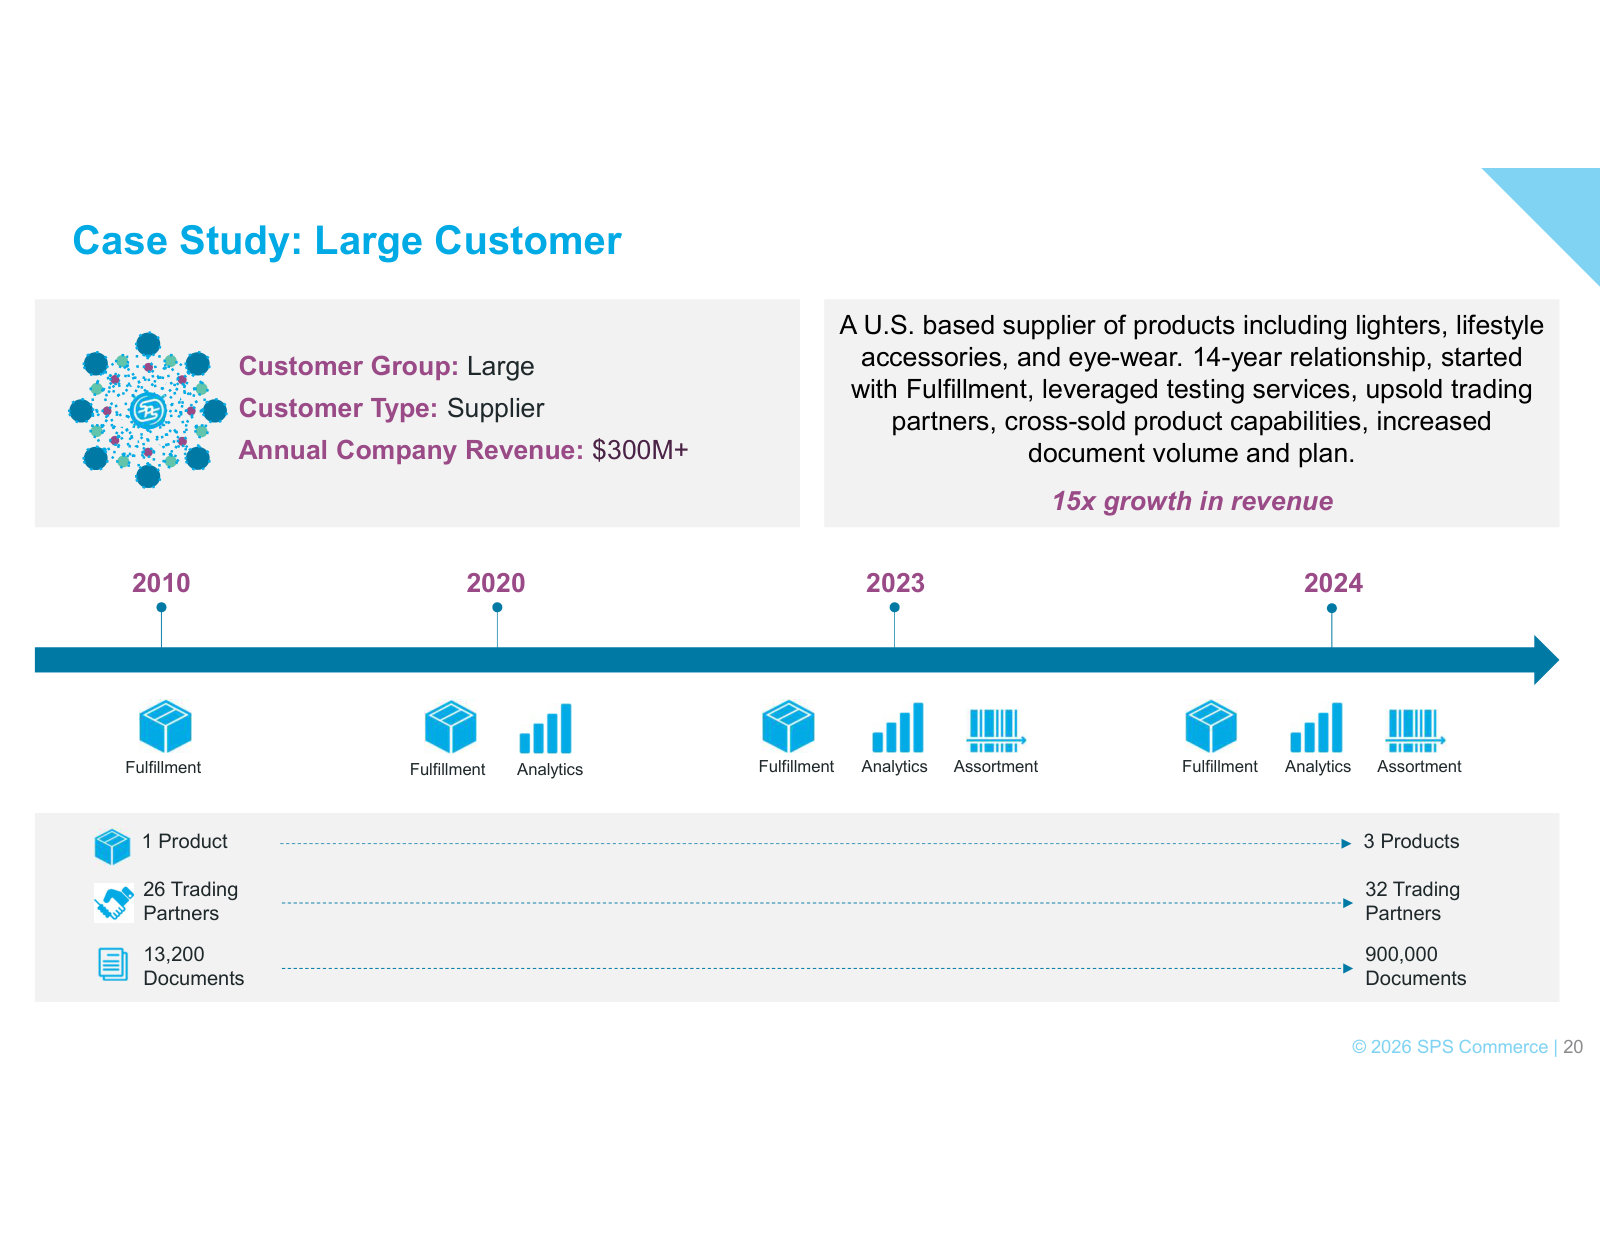
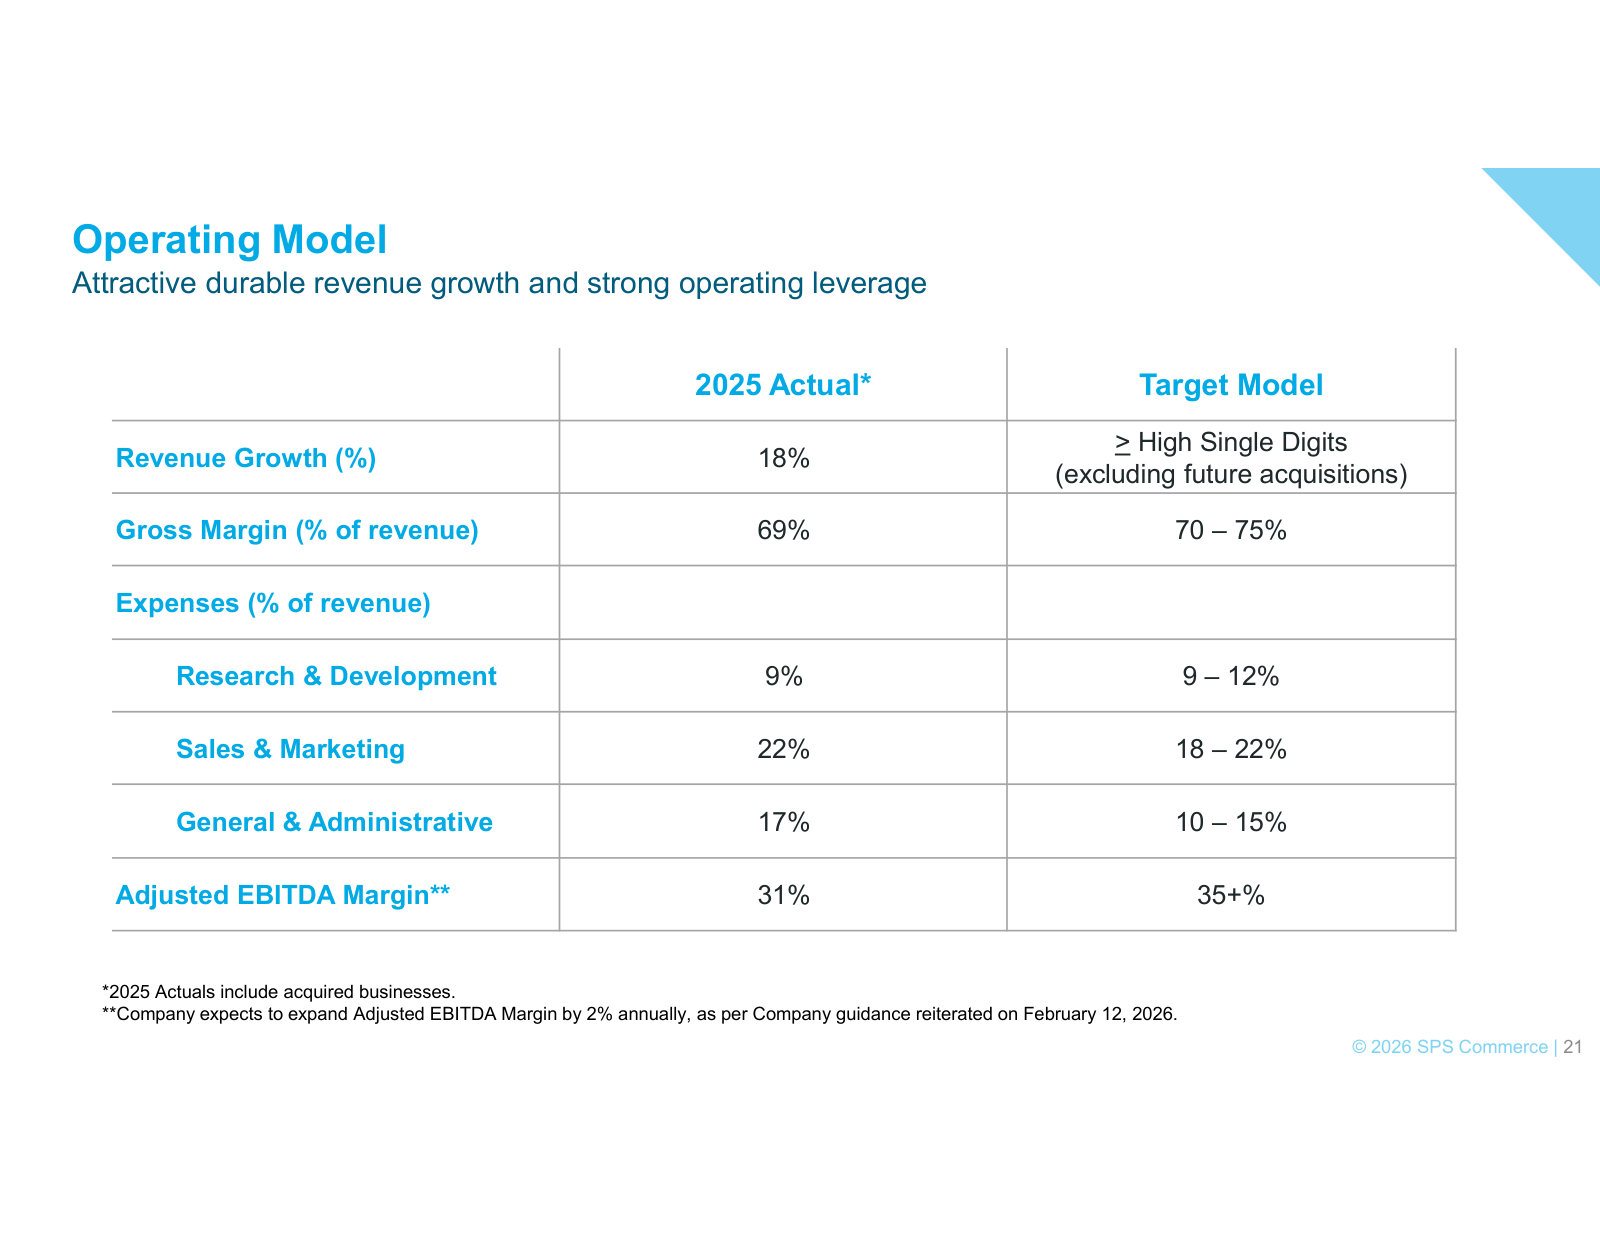
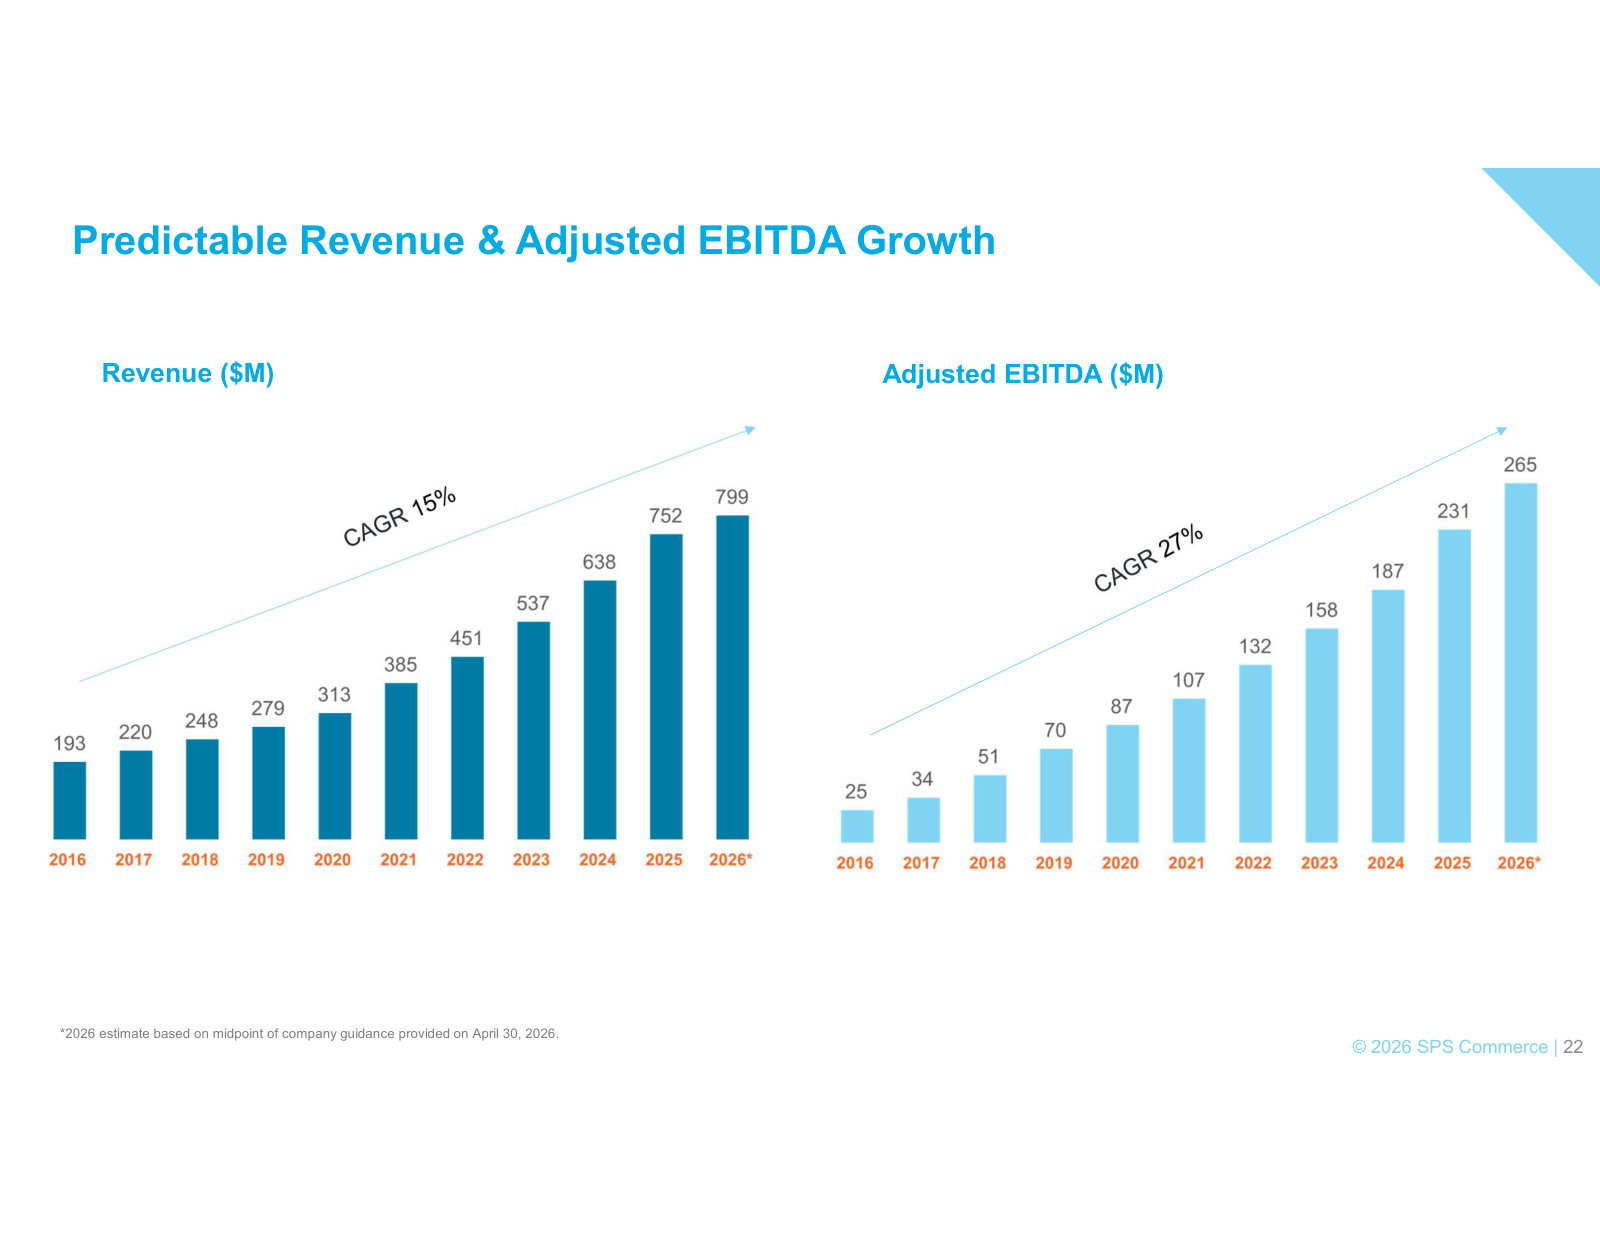
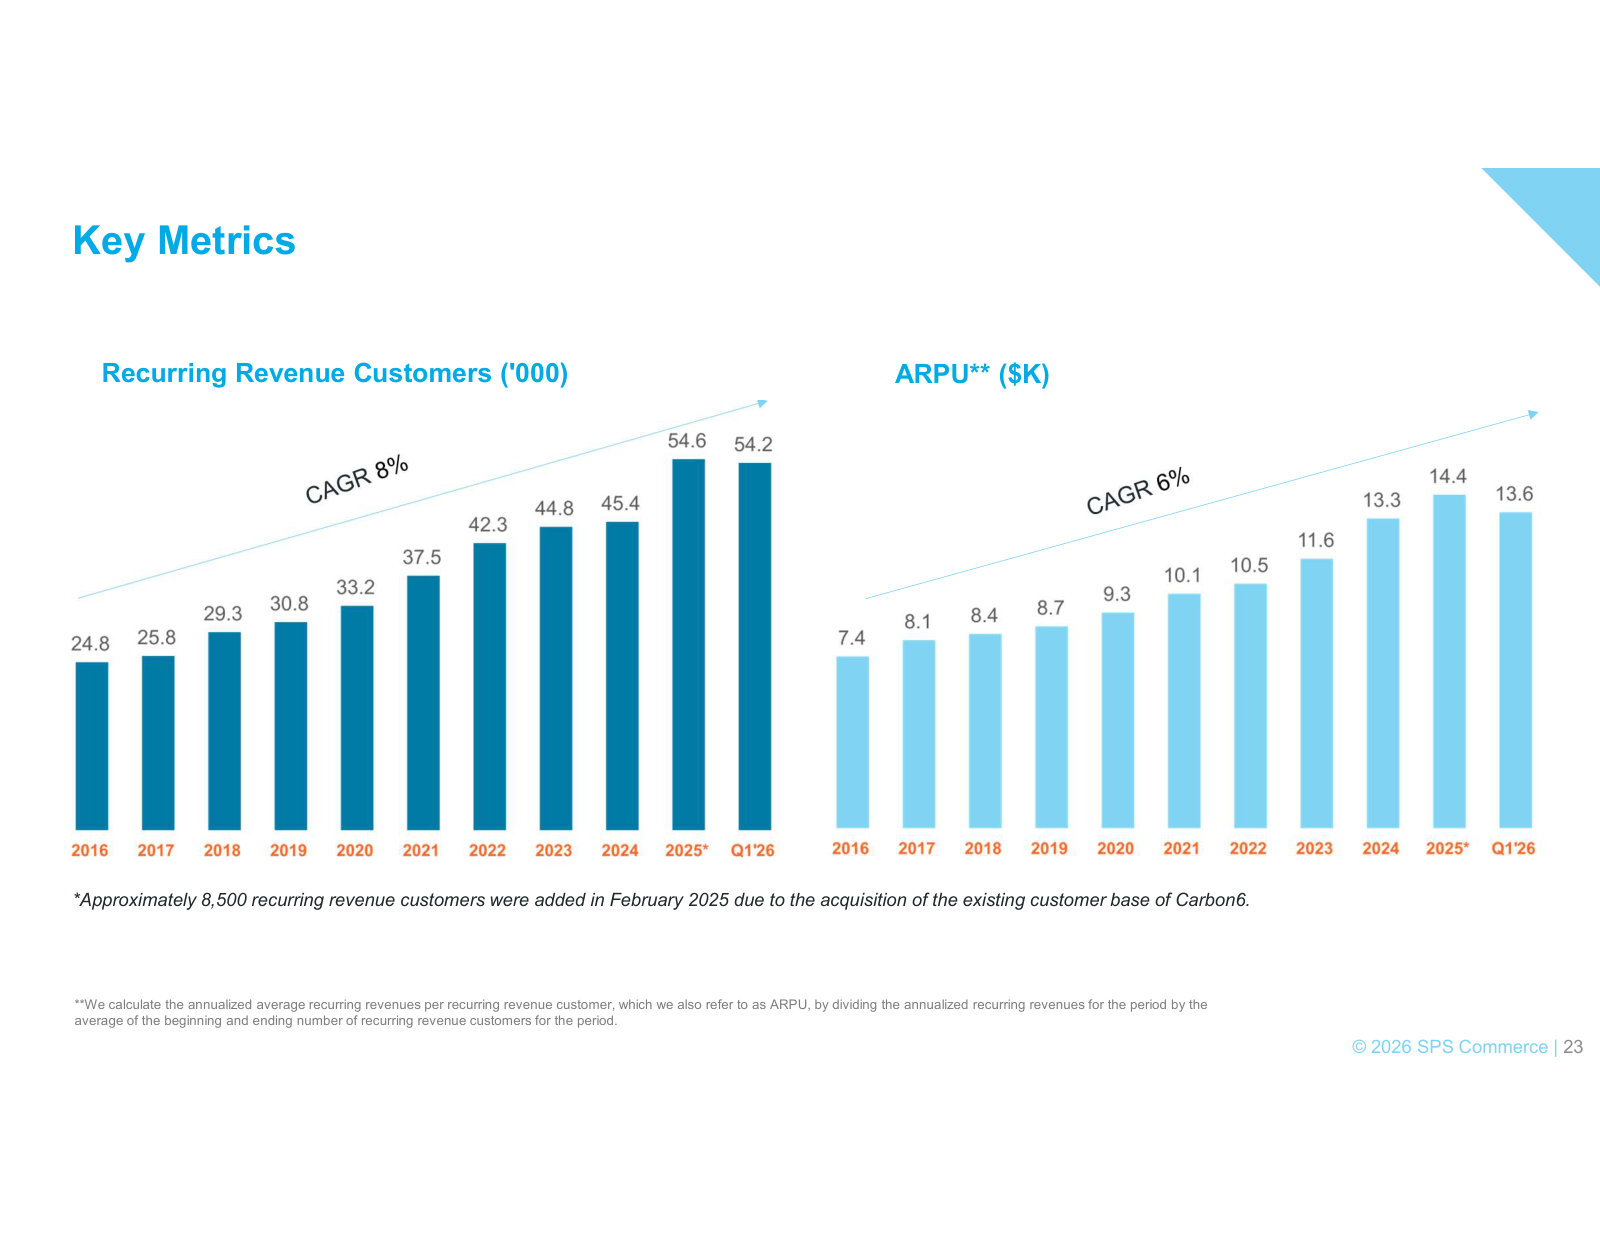
p. 3 — The investment case on one slide — large TAM, global footprint, viral go-to-market and a growth track record. · Open the full presentation →p. 5 — The current framing of the network advantage: expertise, a multi-solution portfolio, ecosystem and agentic AI. · Open the full presentation →p. 6 — The retail supply-chain steps SPS spans (analyze to pay) and the four customer types it connects. · Open the full presentation →p. 7 — Scale and proof points as of 2026: 50,000+ customers, 3,500 buying organizations, and a big share of top retailers and brands. · Open the full presentation →p. 8 — Why SPS frames itself as an AI play — the network's data (300k+ relationships, 750M+ transactions) as the training set. · Open the full presentation →p. 9 — MAX, the new agentic AI product line — Chat, Monitor and Connect — built on the network's proprietary data. · Open the full presentation →p. 13 — The market: $11.1B global and $6.5B U.S. total addressable market. · Open the full presentation →p. 15 — ARPU headroom — ~80% of customers spend below the current average, well under the per-customer opportunity. · Open the full presentation →p. 18 — Small-customer case study: 6x revenue over two years as trading partners and document volume grew. · Open the full presentation →p. 19 — Medium-customer case study: 110x revenue over eleven years across added partners and products. · Open the full presentation →p. 20 — Large-customer case study: 15x revenue over fourteen years by layering on products and partners. · Open the full presentation →p. 21 — 2025 actuals against the target model — 18% revenue growth, 69% gross margin, 31% adjusted EBITDA margin. · Open the full presentation →p. 22 — The current financial track record, 2016-2026E — revenue toward ~$799M and adjusted EBITDA toward ~$265M. · Open the full presentation →p. 23 — Customer count and ARPU through Q1 2026, with the Carbon6 acquisition noted in the 2025 step-up. · Open the full presentation →